# ------------------
this.is.a.numer <- 3
print(this.is.a.numer)
# ------------------
2 <- this.is.a.numer
`2` <- this.is.a.numer
print(2)
print(`2`)
# ------------------
`@_@` <- "funny"
paste0("You look like ", `@_@`)
# ------------------
`@this` <- 3
print(`@this`)
# ------------------
`I hate R programming` <- "No, you don't"
print(`I hate R programming`)Lecture 02: R Objects, Functions, Packages
Getting Started
Jihong Zhang*, Ph.D
Educational Statistics and Research Methods (ESRM) Program*
University of Arkansas
2024-10-09
Today’s Class
- R objects and prebuilt function
- Data types
- Vectors
- Coercion
- Not available (NA)
- Sorting
- Vector arithmetics
- Indexing
- Functions
- Input and Output
- Arguments
- Pakcages
R Object and Pre-built function
Naming Convention of R Object is so @_@
Objects
To do data clean, data analysis, or statistics, we need to store some information and manipulate it in R. The information that we can create/change/remove is called R object.
Suppose we want to solve several quadratic equations of the form \(x^2 + x - 1 = 0\). We know that the quadratic formula gives us the solutions:
\[ \frac{-b\pm\sqrt{b^2 -4ac}}{2a} \]
The solution depend on the values of a, b, and c. One advantage of programming languages is that we can define variables and write expressions with these variables
We use
<-to assign values to the variables. We can also assign values using=instead of<-, but we recommend against using=to avoid confusion.To see the value stored in a variable, we simply ask R to evaluate
coef_aand it shows the stored value:- A more explicit way to ask R to show us the value stored in
coef_ais usingprintfunction like this (printis a prebuilt function in R, we will explain later):
- A more explicit way to ask R to show us the value stored in
Workspace
So we have object, then where they are stored in R. The workspace is the place storing the objects we can use:
You can see all the variables saved in your workspace by typing:
In RStudio, the Environment tab shows the values:
![]()
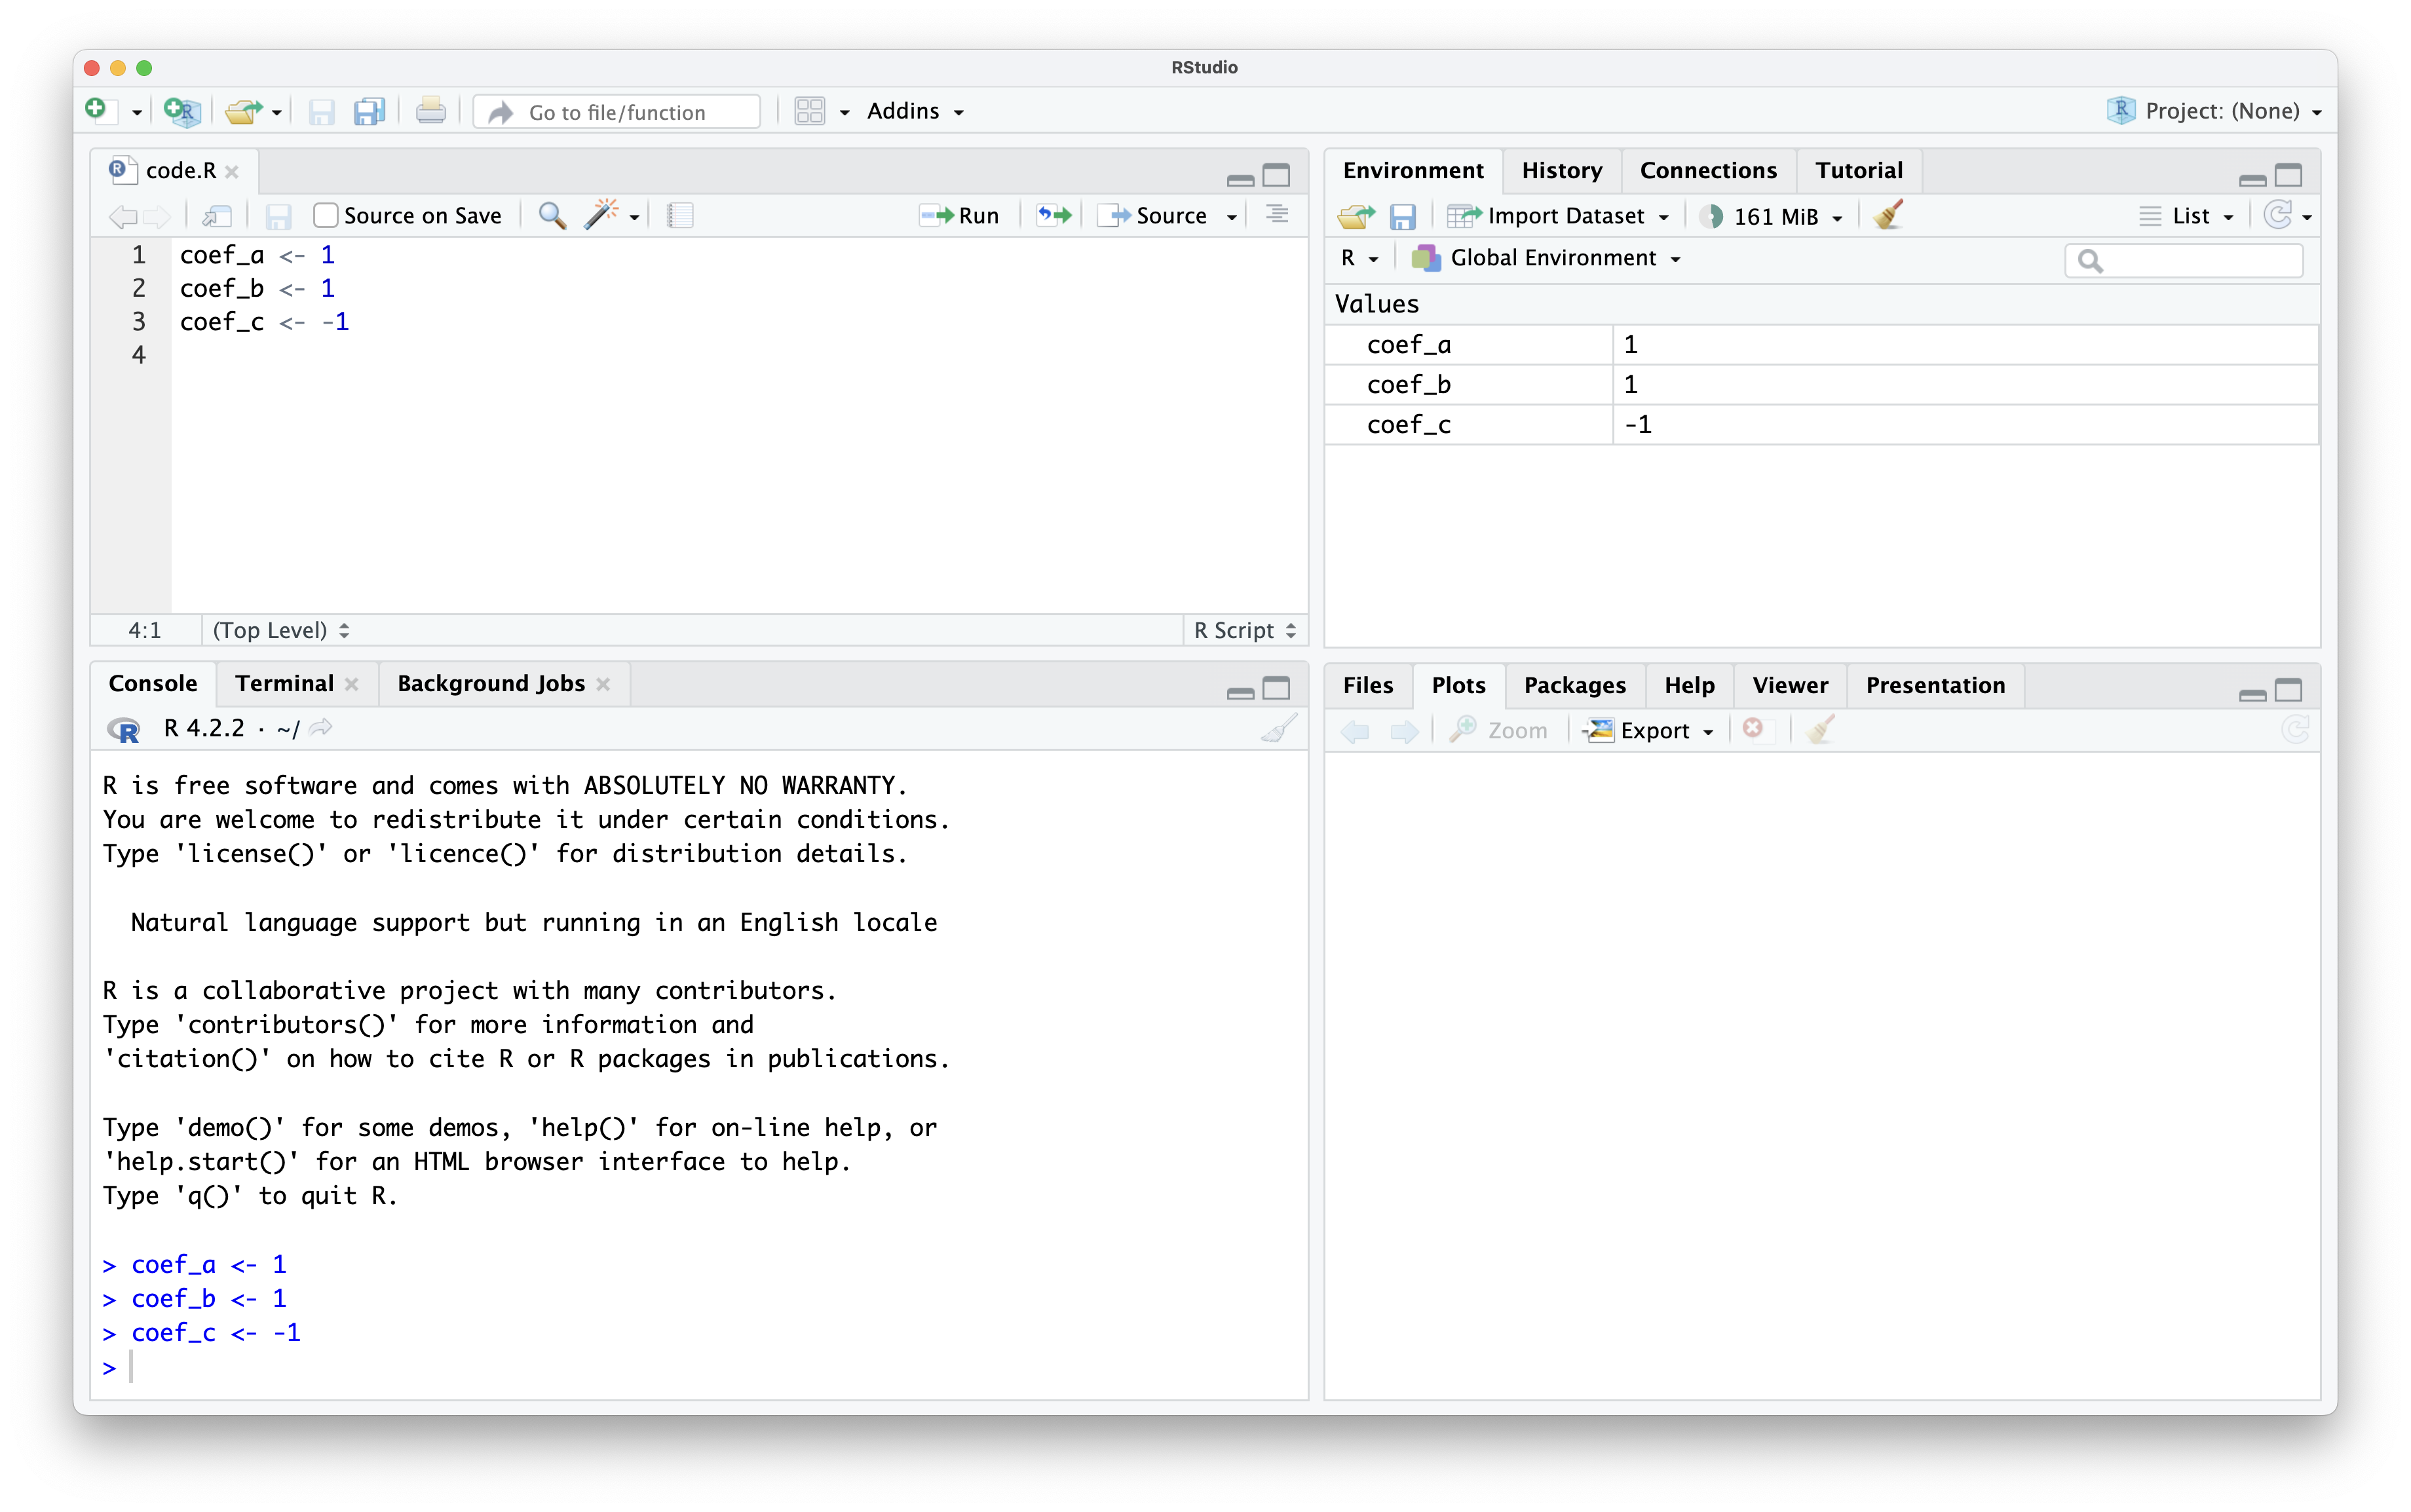
We should see
coef_a,coef_b, andcoef_c.Missing R object in workspace: If you try to recover the value of a variable that is not in your workspace, you receive an error. For example, if you type
some_random_objectyou will receive the following message:Error: object 'some_random_object' not found.Now since these values are saved in variables, to obtain a solution to our equation, we use the quadratic formula:
Operators
-: is a negative operator which switches the sign of object+and*and/: addition, multiplication, and divisionsqrt: a prebuilt R function of calculating the squared root of the object^: exponent operator to calculate the “power” of the “base”;a^3: a to the 3rd power
Prebuilt functions
Functions: Once we defined the objects, the data analysis process can usually be described as a series of functions applied to the data.
In other words, we considered “function” as a set of pre-specified operations (e.g., macro in SAS)
R includes several predefined functions and most of the analysis pipelines we construct make extensive use of these.
We already used or discussed the
install.packages,library, andlsfunctions. We also used the functionsqrtto solve the quadratic equation above.
Evaluation: In general, we need to use parentheses followed by a function name to evaluate a function.
- If you type
ls, the function is not evaluated and instead R shows you the code that defines the function. If you typels()the function is evaluated and, as seen above, we see objects in the workspace.
- If you type
Function Arguments: Unlike
ls, most functions require one or more arguments to specify the settings of the function.For example, we assign different object to the argument of the function
log. Remember that we earlier definedcoef_ato be 1:
Help: You can find out what the function expects and what it does by reviewing the very useful manuals included in R. You can get help by using the
helpfunction like this:The help page will show you what arguments the function is expecting. For example,
logneedsxandbaseto run.The base of the function
logdefaults tobase = exp(1)makinglogthe natural log by default.![]()
You can also use
argsto look at the argumentsIf specifying the arguments’ names, then we can include them in whatever order we want:

Prebuilt objects
There are several datasets or values that are included for users to practice and test out functions. For example, you can use \(\pi\) in your calculation directly:
Or infinity value \(\infty\):
You can see all the available datasets by typing:
For example, if you type
iris, it will output the famous (Fisher’s or Anderson’s) iris data set gives the measurements in centimeters of the variables sepal length and width and petal length and width:You can check the detailed help page of
irisusing?as we did for functions.
Variable Names
When writing code in R, it’s important to choose variable names that are both meaningful and avoid conflicts with existing functions or reserved words in the language.
For example, avoid using
cas variable name because R has a existing prebuilt functionc():
Some basic rules in R are that variable names have to start with a letter, can’t contain spaces, and should not be variables that are predefined in R, such as
c.A nice convention to follow is to use meaningful words that describe what is stored, use only lower case, and use underscores as a substitute for spaces.
Saving workspace
Objects and functions remain in the workspace until you end your session or erase them with the function
rm.Autosave: Your current workspaces also can be saved for later use.
- In fact, when you quit R, Rstudio asks you if you want to save your workspace as
.RData. If you do save it, the next time you start R, the program will restore the workspace.
- In fact, when you quit R, Rstudio asks you if you want to save your workspace as
ManualSave: We actually recommend against saving the workspace this way because, as you start working on different projects, it will become harder to keep track of what is saved.
Commenting your code
If a line of R code starts with the symbol
#, it is a comment and is not evaluated.We can use this to write reminders of why we wrote particular code:
Exercises (30 minutes)
What is the sum of the first 100 positive integers? The formula for the sum of integers 1 through n is \(n(n+1)/2\). Define
\(n=100\) and then use R to compute the sum of 1 through 100 using the formula. What is the sum?
Now use the same formula to compute the sum of the integers from 1 through 1000.
Look at the result of typing the following code into R:
- Based on the result, what do you think the functions
seqandsumdo? You can use help.
- Based on the result, what do you think the functions
In math and programming, we say that we evaluate a function when we replace the argument with a given value. So if we type
sqrt(4), we evaluate thesqrtfunction. In R, you can evaluate a function inside another function. The evaluations happen from the inside out. Use one line of code to compute the log, in base 10, of the square root of 100.Which of the following will always return the numeric value stored in x? You can try out examples and use the help system if you want.
Data types
Check types of object
Variables in R can be of different types.
- For example, we need to distinguish numbers from character strings and tables from simple lists of numbers.
The function
classhelps us determine what type of object we have:
- To work efficiently in R, it is important to learn the different types of variables and what we can do with these.
Data frames
The most common way of storing a dataset in R is in a data frame.
A data frame is a table with rows representing observations and the different variables reported for each observation defining the columns.
Data frames has multiple informatiom:
We can check the number of rows and number of columns:
We can check the columns names
The function
stris useful for finding out more about the structure of an data.frame'data.frame': 150 obs. of 5 variables: $ Sepal.Length: num 5.1 4.9 4.7 4.6 5 5.4 4.6 5 4.4 4.9 ... $ Sepal.Width : num 3.5 3 3.2 3.1 3.6 3.9 3.4 3.4 2.9 3.1 ... $ Petal.Length: num 1.4 1.4 1.3 1.5 1.4 1.7 1.4 1.5 1.4 1.5 ... $ Petal.Width : num 0.2 0.2 0.2 0.2 0.2 0.4 0.3 0.2 0.2 0.1 ... $ Species : Factor w/ 3 levels "setosa","versicolor",..: 1 1 1 1 1 1 1 1 1 1 ...We can show the first 3 or last 3 lines using the function
headandtailSepal.Length Sepal.Width Petal.Length Petal.Width Species 1 5.1 3.5 1.4 0.2 setosa 2 4.9 3.0 1.4 0.2 setosa 3 4.7 3.2 1.3 0.2 setosaSepal.Length Sepal.Width Petal.Length Petal.Width Species 148 6.5 3.0 5.2 2.0 virginica 149 6.2 3.4 5.4 2.3 virginica 150 5.9 3.0 5.1 1.8 virginica
Have access to certain column
we can access the different variables represented by columns included in this data frame using
$or[["column_name"]].
Note that if we use
["column_name"], it will extract single-column data frame
Vectors
The object
iris$Sepal.Widthis not one number but several. We call these types of objects vectors.We use the term vectors to refer to objects with several entries. The function
lengthtells you how many entries are in the vector:We can also calculate some descriptive statistics using
max,min,sdif the vector contains numeric values only
Vector also can have multiple types: numeric, character (string), logistic, factor
You cannot calculate
min/max/meanfor the factor vector containing string values. It will return not applied (NA)[1] setosa setosa setosa setosa setosa setosa Levels: setosa versicolor virginica[1] "factor"[1] NA- or the character vector
You can calculate the mean of the logical vector, which is the proportion of
TRUEvalues in the vector:You can also calculate the distribution of the factor vector using
tablefunction:
Factor
Factors are useful for storing categorical data
We can see that there are only 3 types of iris by using the
levelsfunction:In the background, R stores these levels as integers and keeps a map to keep track of the labels. This is more memory efficient than storing all the characters.
Stop at https://rafalab.dfci.harvard.edu/dsbook-part-1/R/R-basics.html#sec-factors
R Function
Play sounds
Want to watch firework in R?
![]()
ESRM 64503 - Lecture 02: Object/Function/Package