Why Network Analysis? A Longitudinal Eating Disorders Case Study
USC Quant Brown Bag
2025-12-02
About me


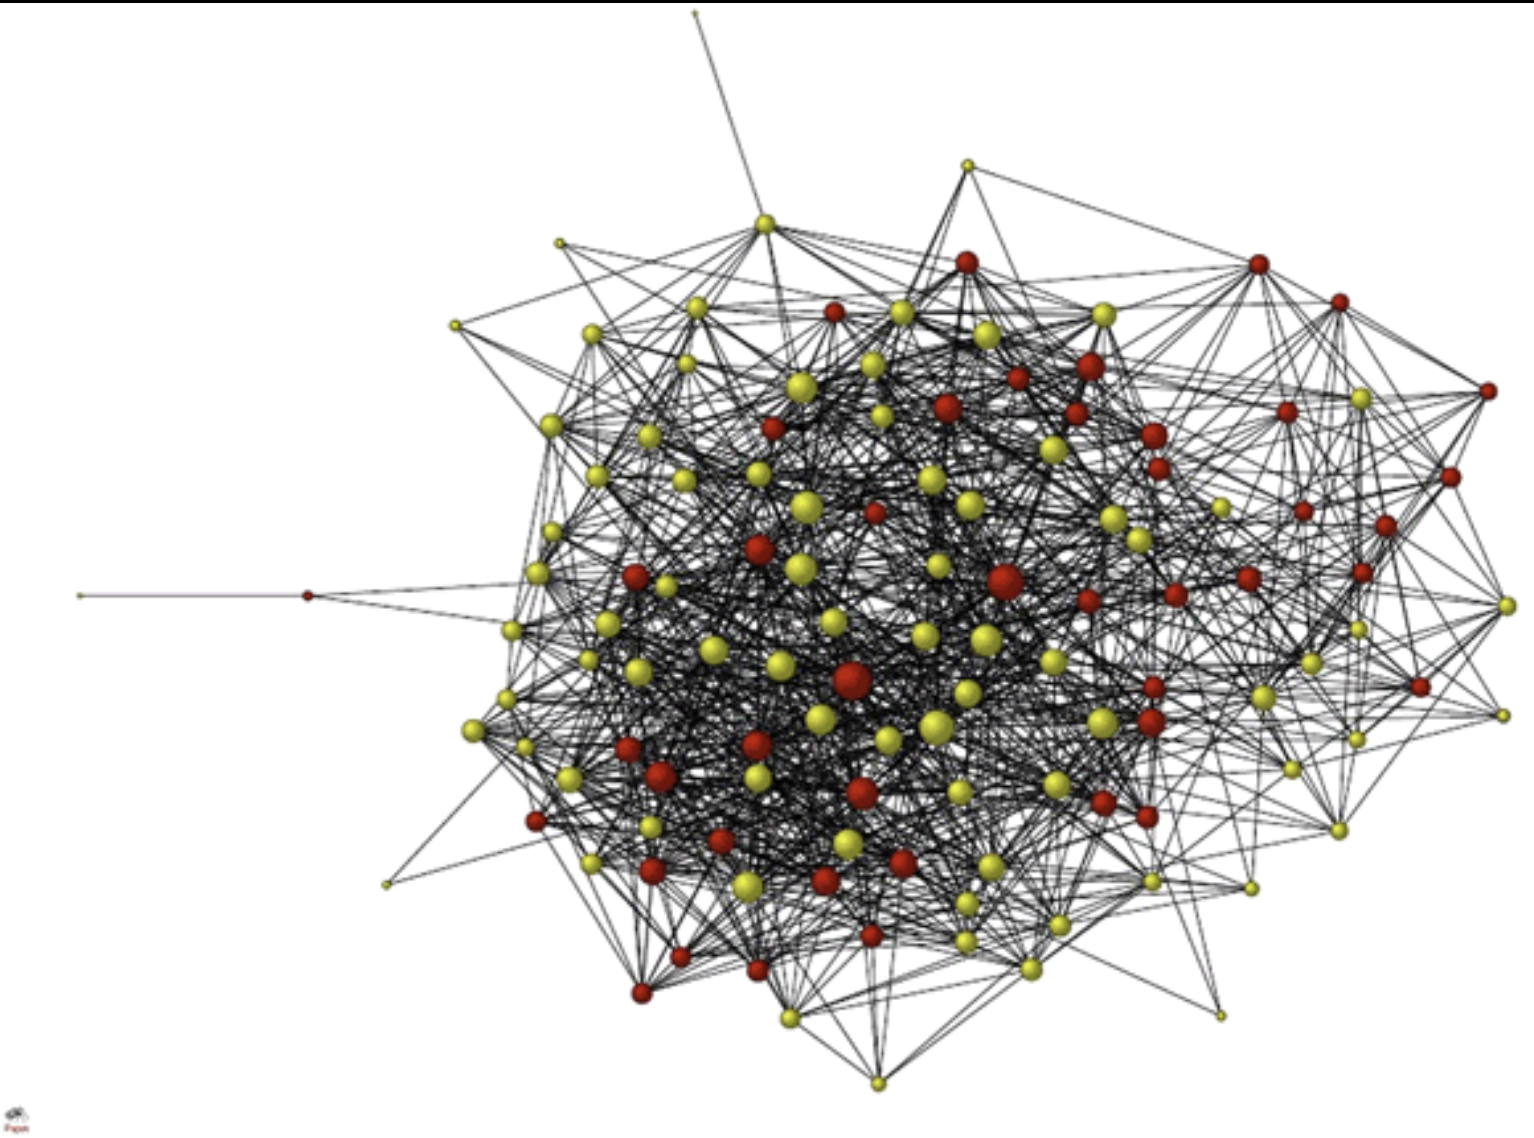
Examples of Varied Networks
Latent Factor Model vs. Psychological Network Model
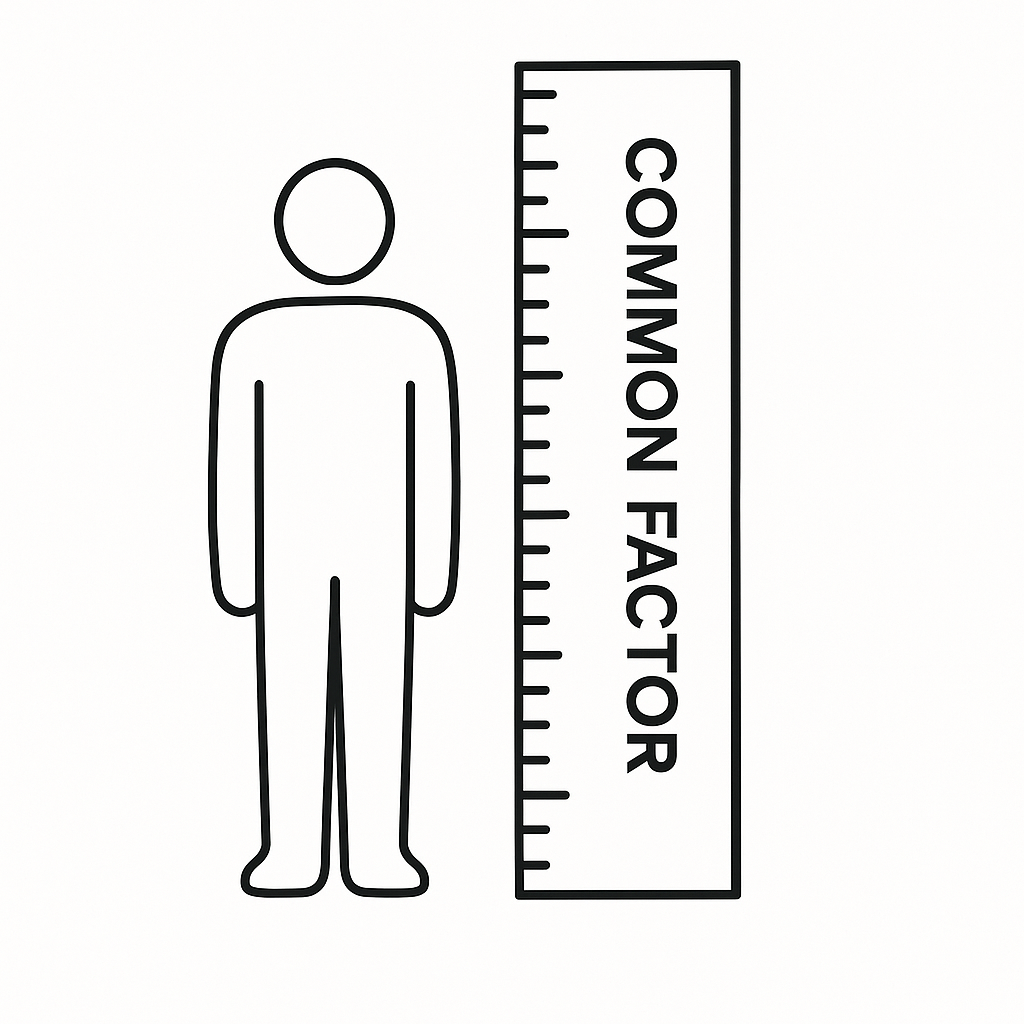
Latent factor model (common factor model) assumes that associations between observed features can be explained by one or more common factors (e.g., agreebleness, conscientiousness).
Psychometric networks, however, assume that associations between observed features are the reason for the development of one system. In this view, “personality” is the network itself.
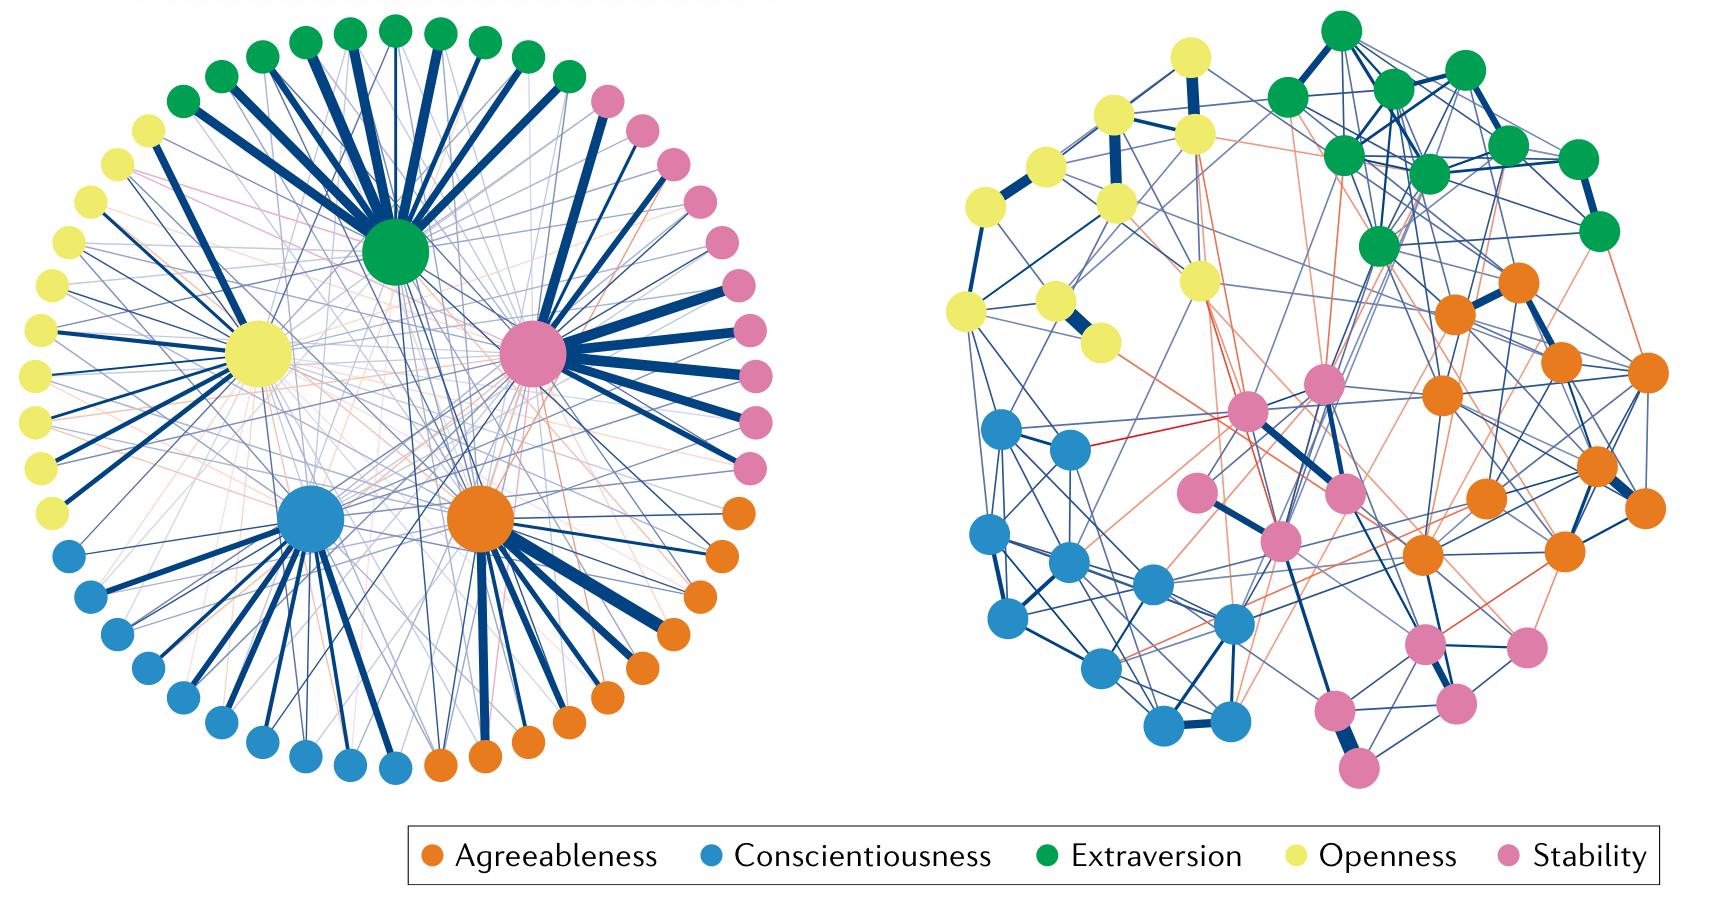
Figure 3: Exploratory factor analysis and psychological network analysis of Big Five personality (Borsboom et al., 2021)
Common factor or Mutualism?
“Openness” dimension:
- Q5. Is original, comes up with new ideas: Disagree (1) to Agree (5) 1
- Q10. Is curious about lots of different things: Disagree (1) to Agree (5)
Does “openness” really exist?

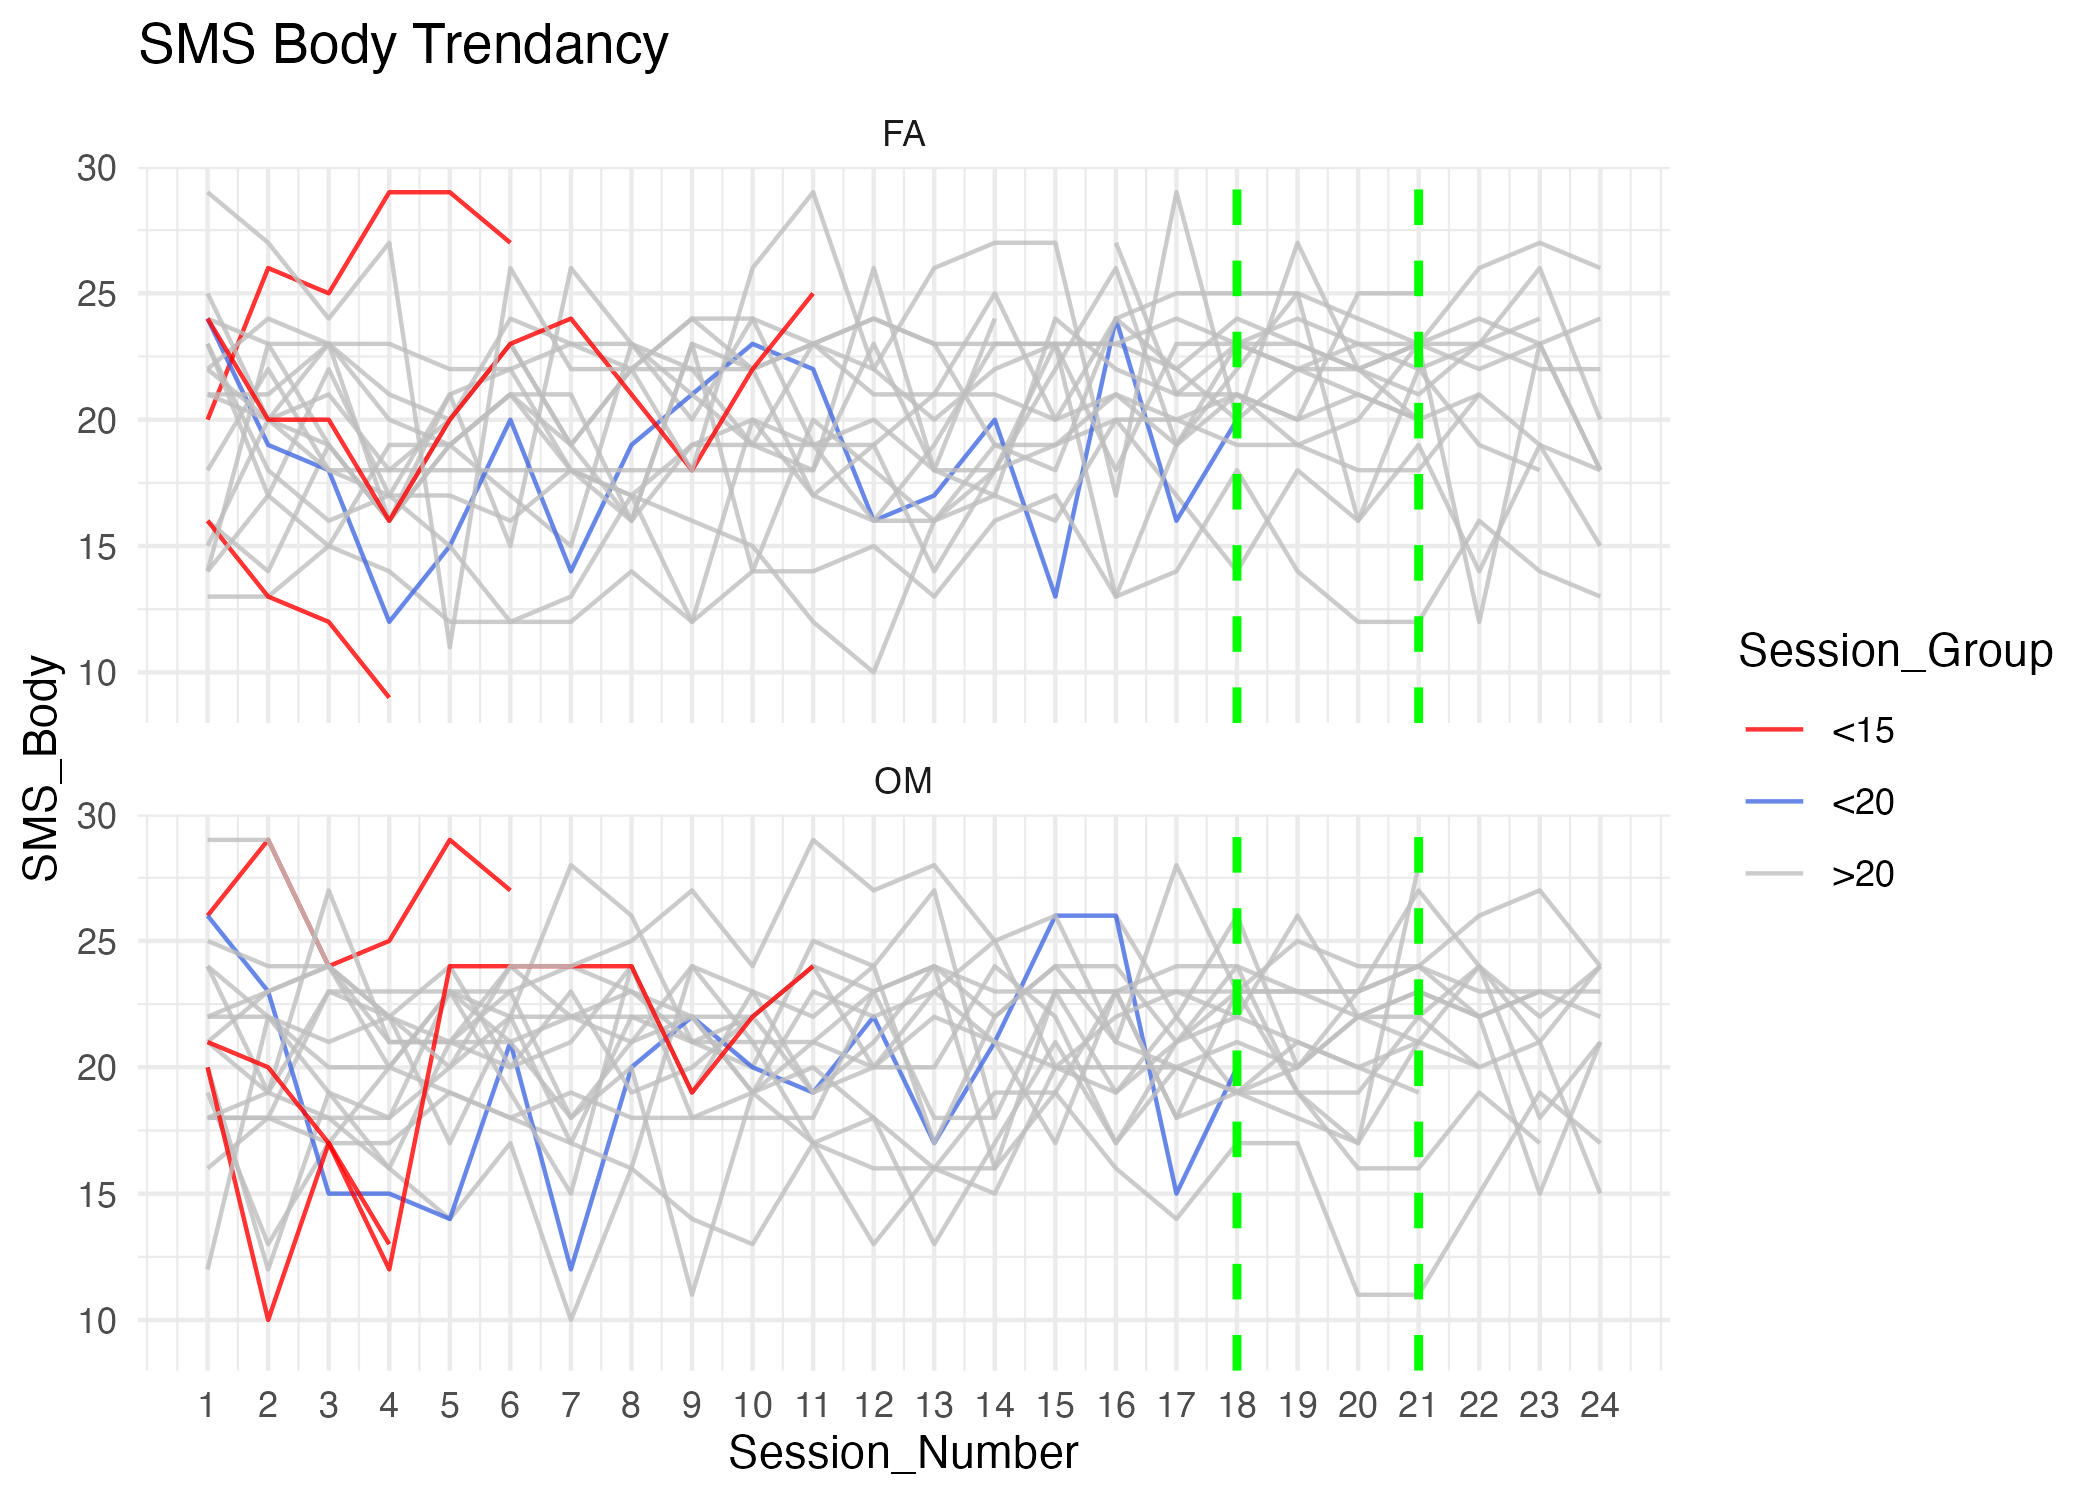
Data
participants completed 8 weeks of FA and OM training
up to 24 EEG-recorded laboratory practice sessions (3 visits per week), during which they completed 20-minutes of standardized audio-guided FA and OM meditation practice (totaling 40 minutes of practice per session).
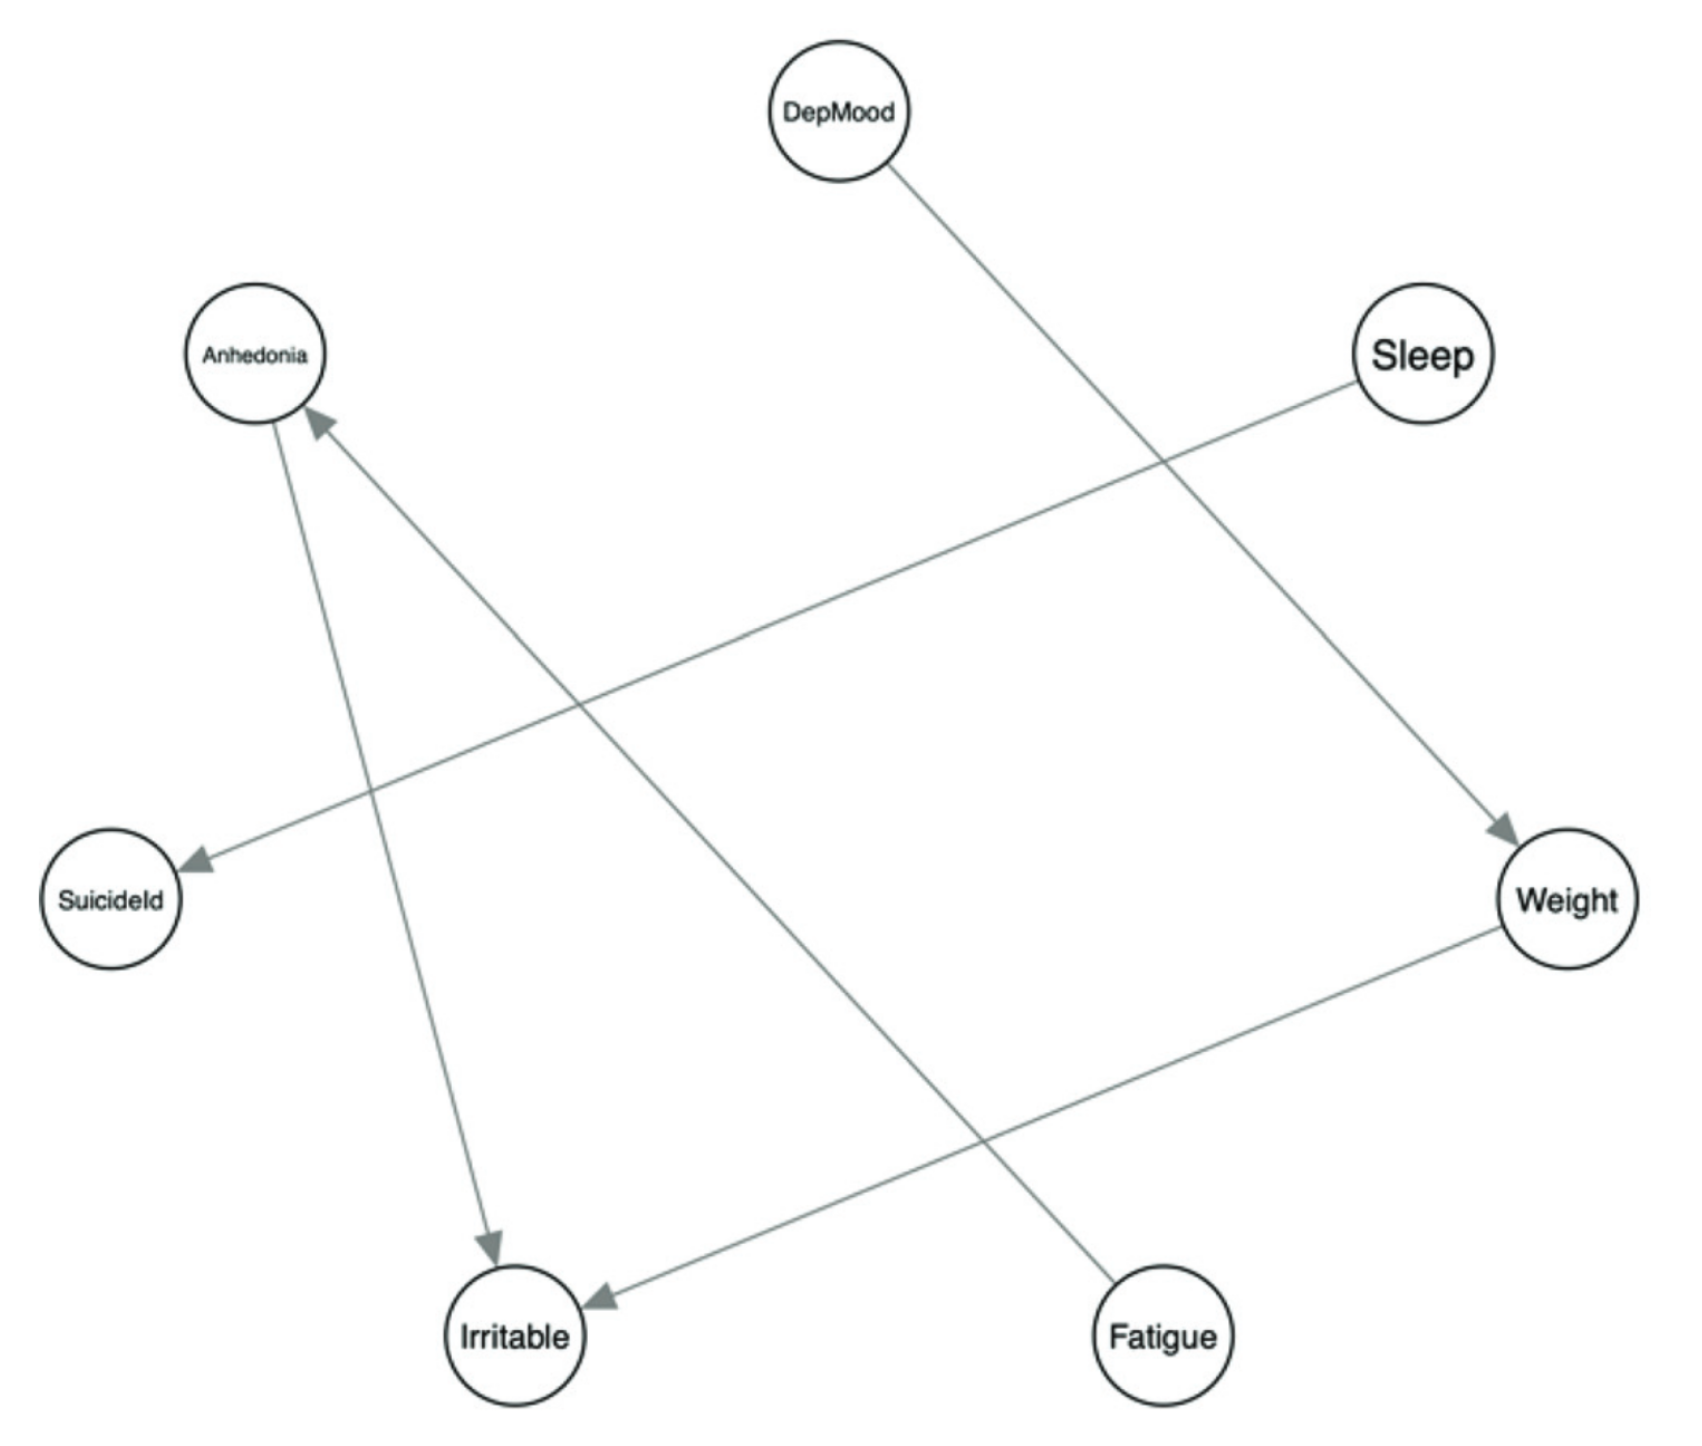
Question 1: Can eating disorders be considered a network?
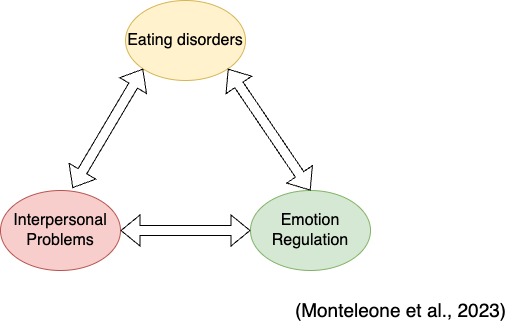
- Understanding interrelationships among components—emotion regulation, interpersonal problems, and eating disorders—can be conceptualized as a symptom network via theoretical frameworks.
The emotion regulation theory suggests that difficulties in emotion regulation can result in ED behaviors.
Interpersonal psychotherapy theory posits that interpersonal problems may exacerbate ED (Murphy et al., 2012).
Empirical studies consider these three to constitute an “ecosystem” (Ambwani et al., 2014). Emotion regulation and interpersonal functioning exhibit reciprocal effects on the maintenance of ED.
The motivation is to obtain a holistic picture of the eating disorders ecosystem. However, the symptom-level dynamics of eating disorders have not been well investigated.
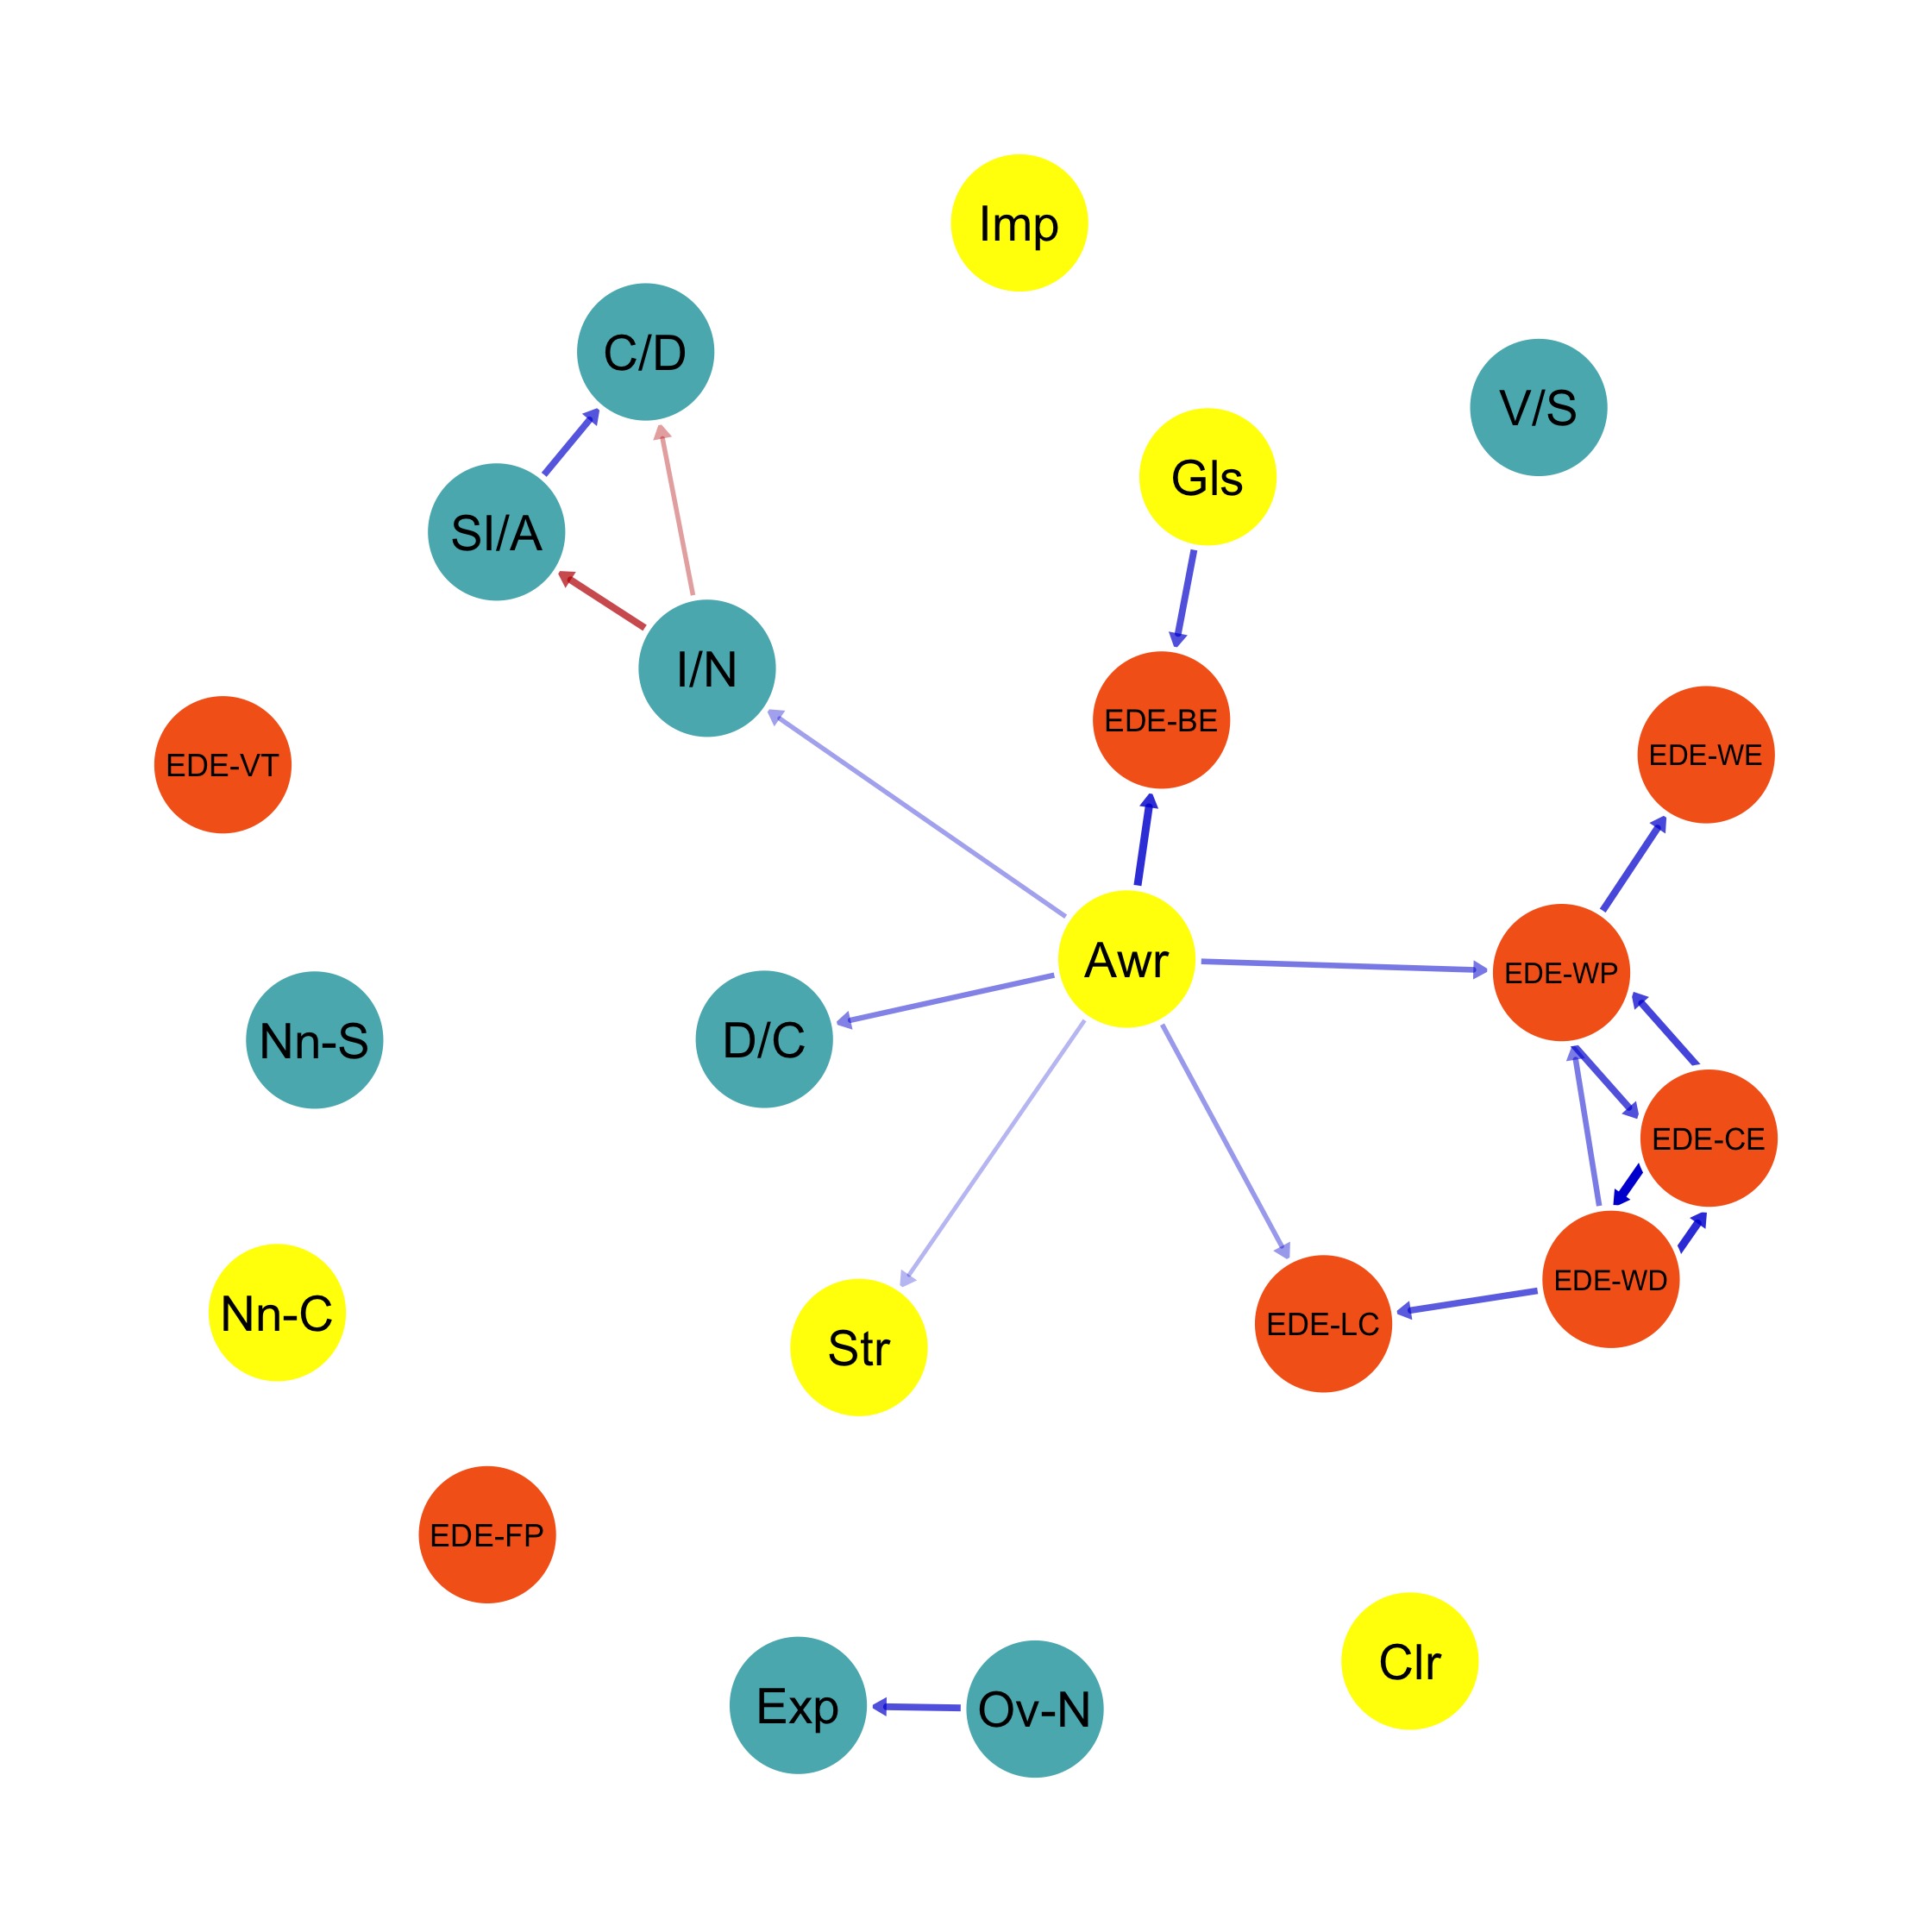
Results
Temporal Network Structure (left: boys; right: girls)
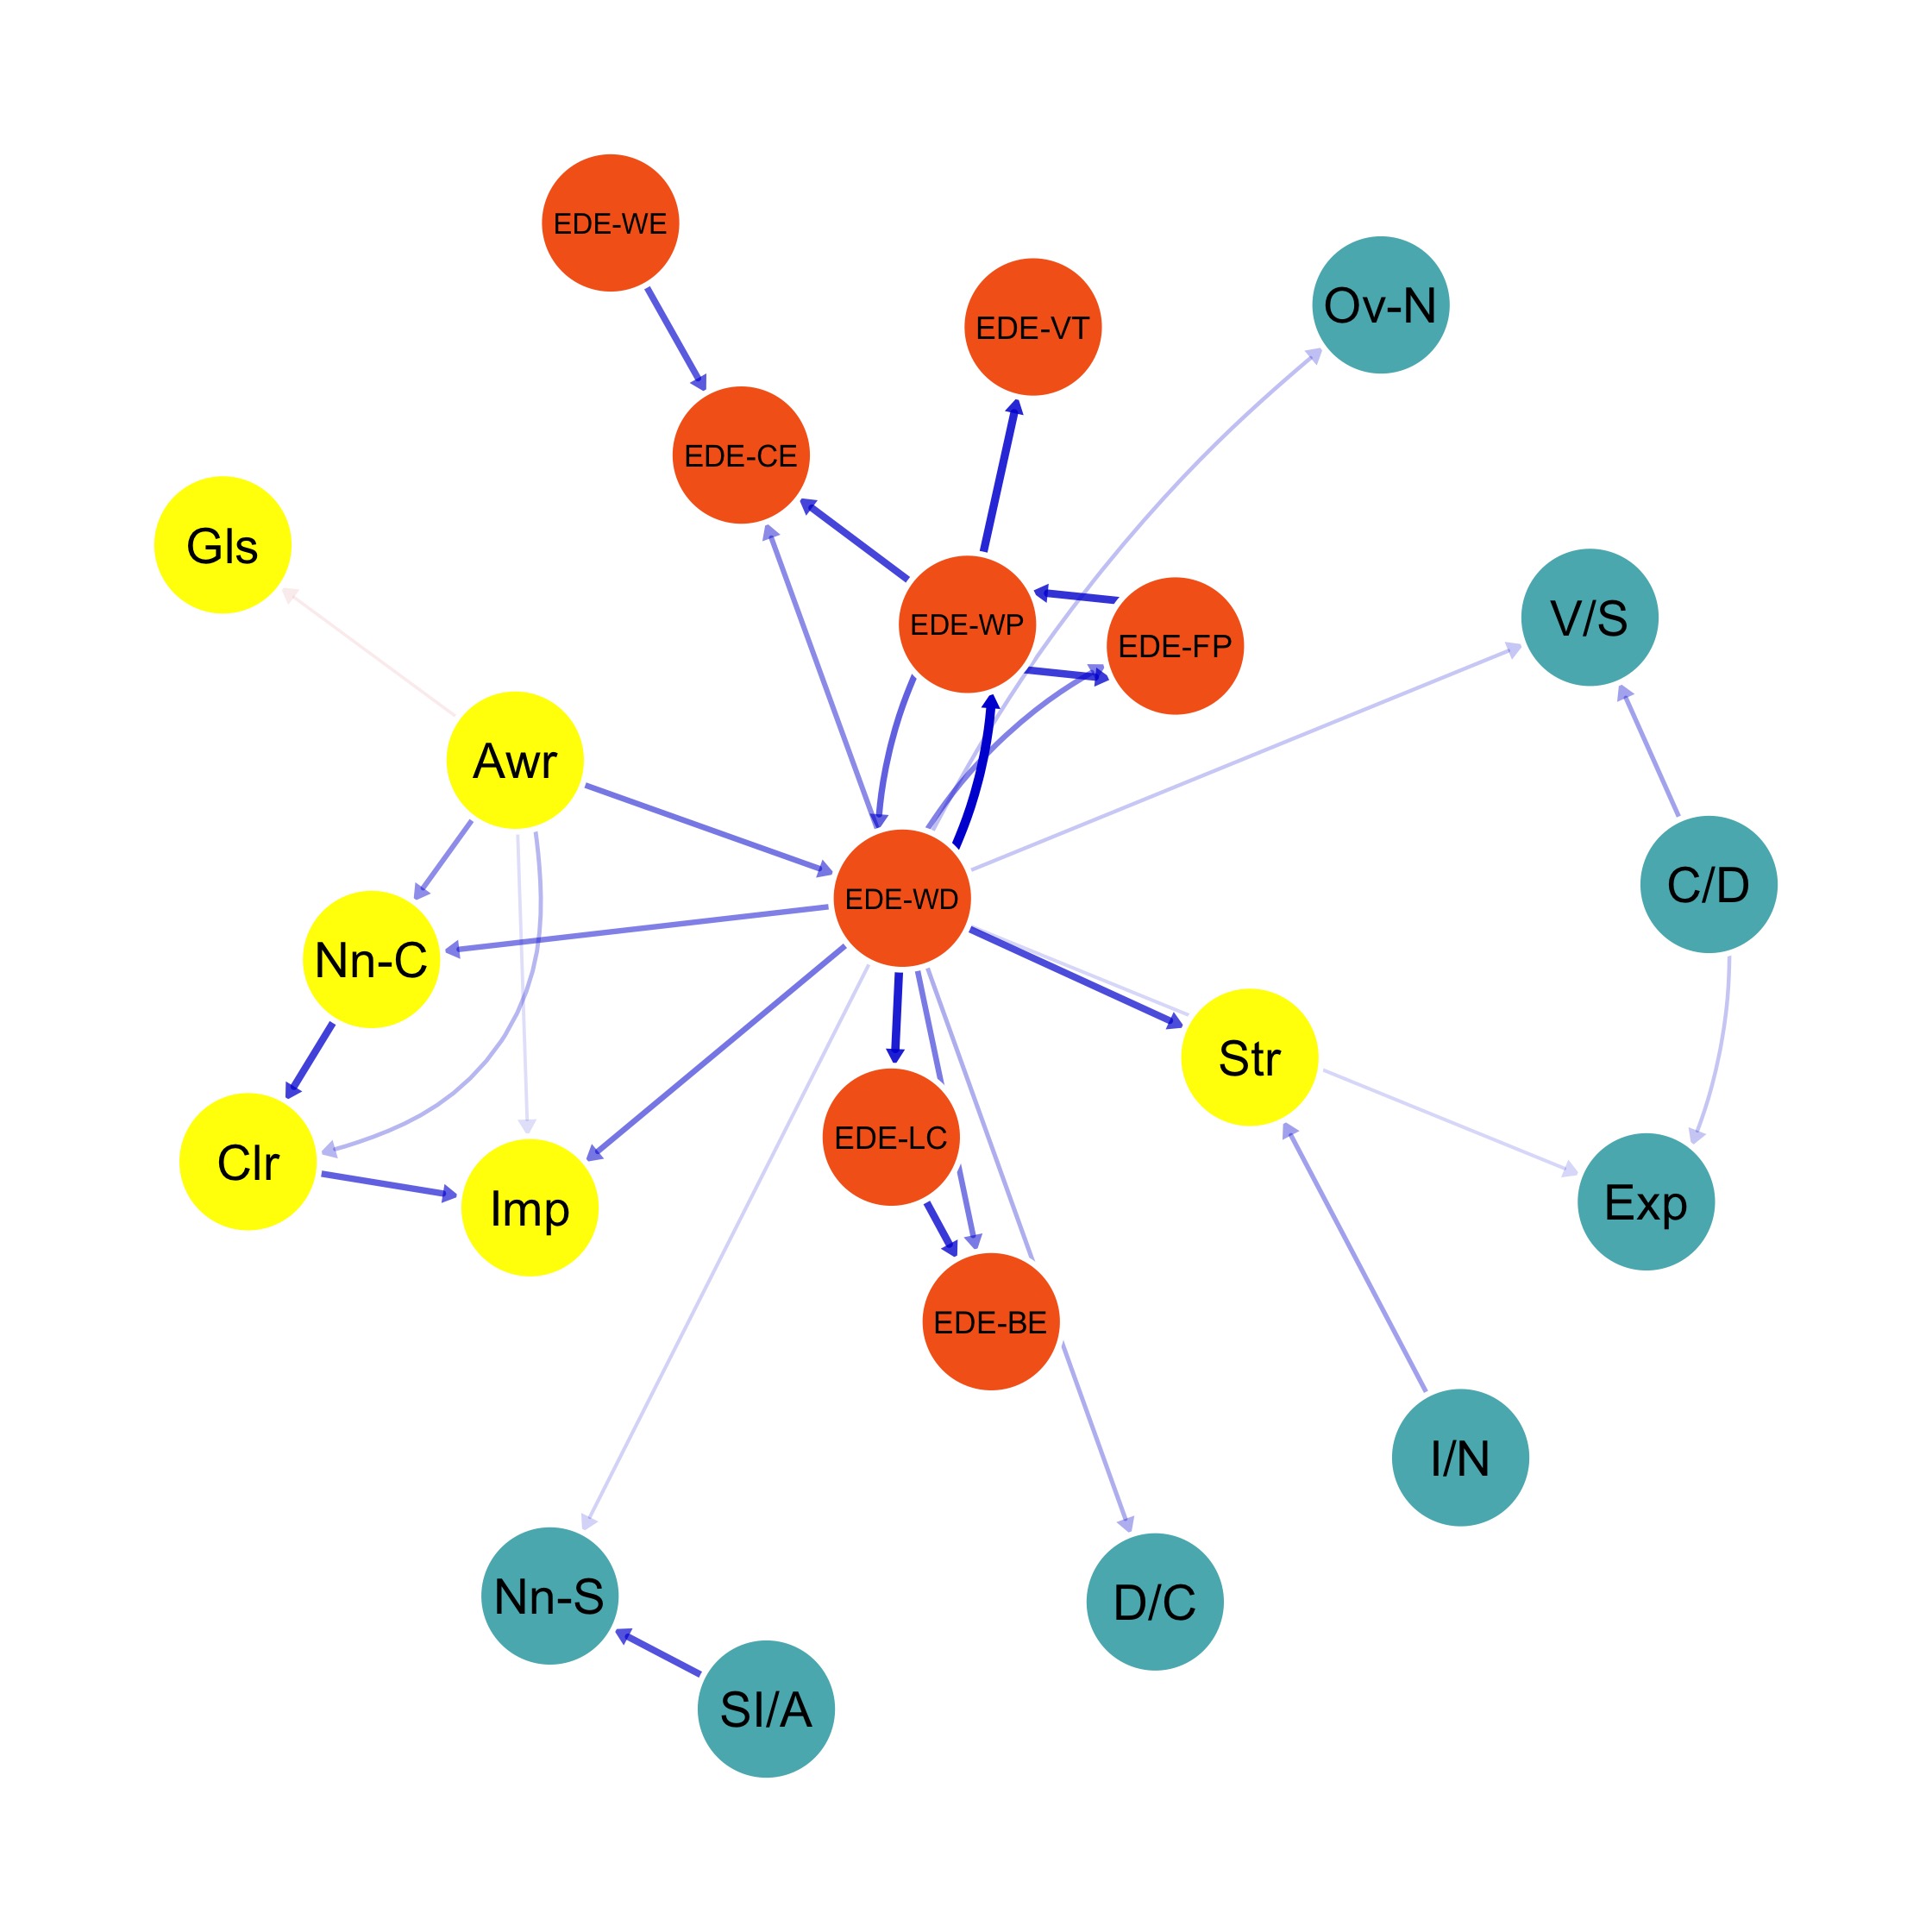
Checking which node’s importance is different
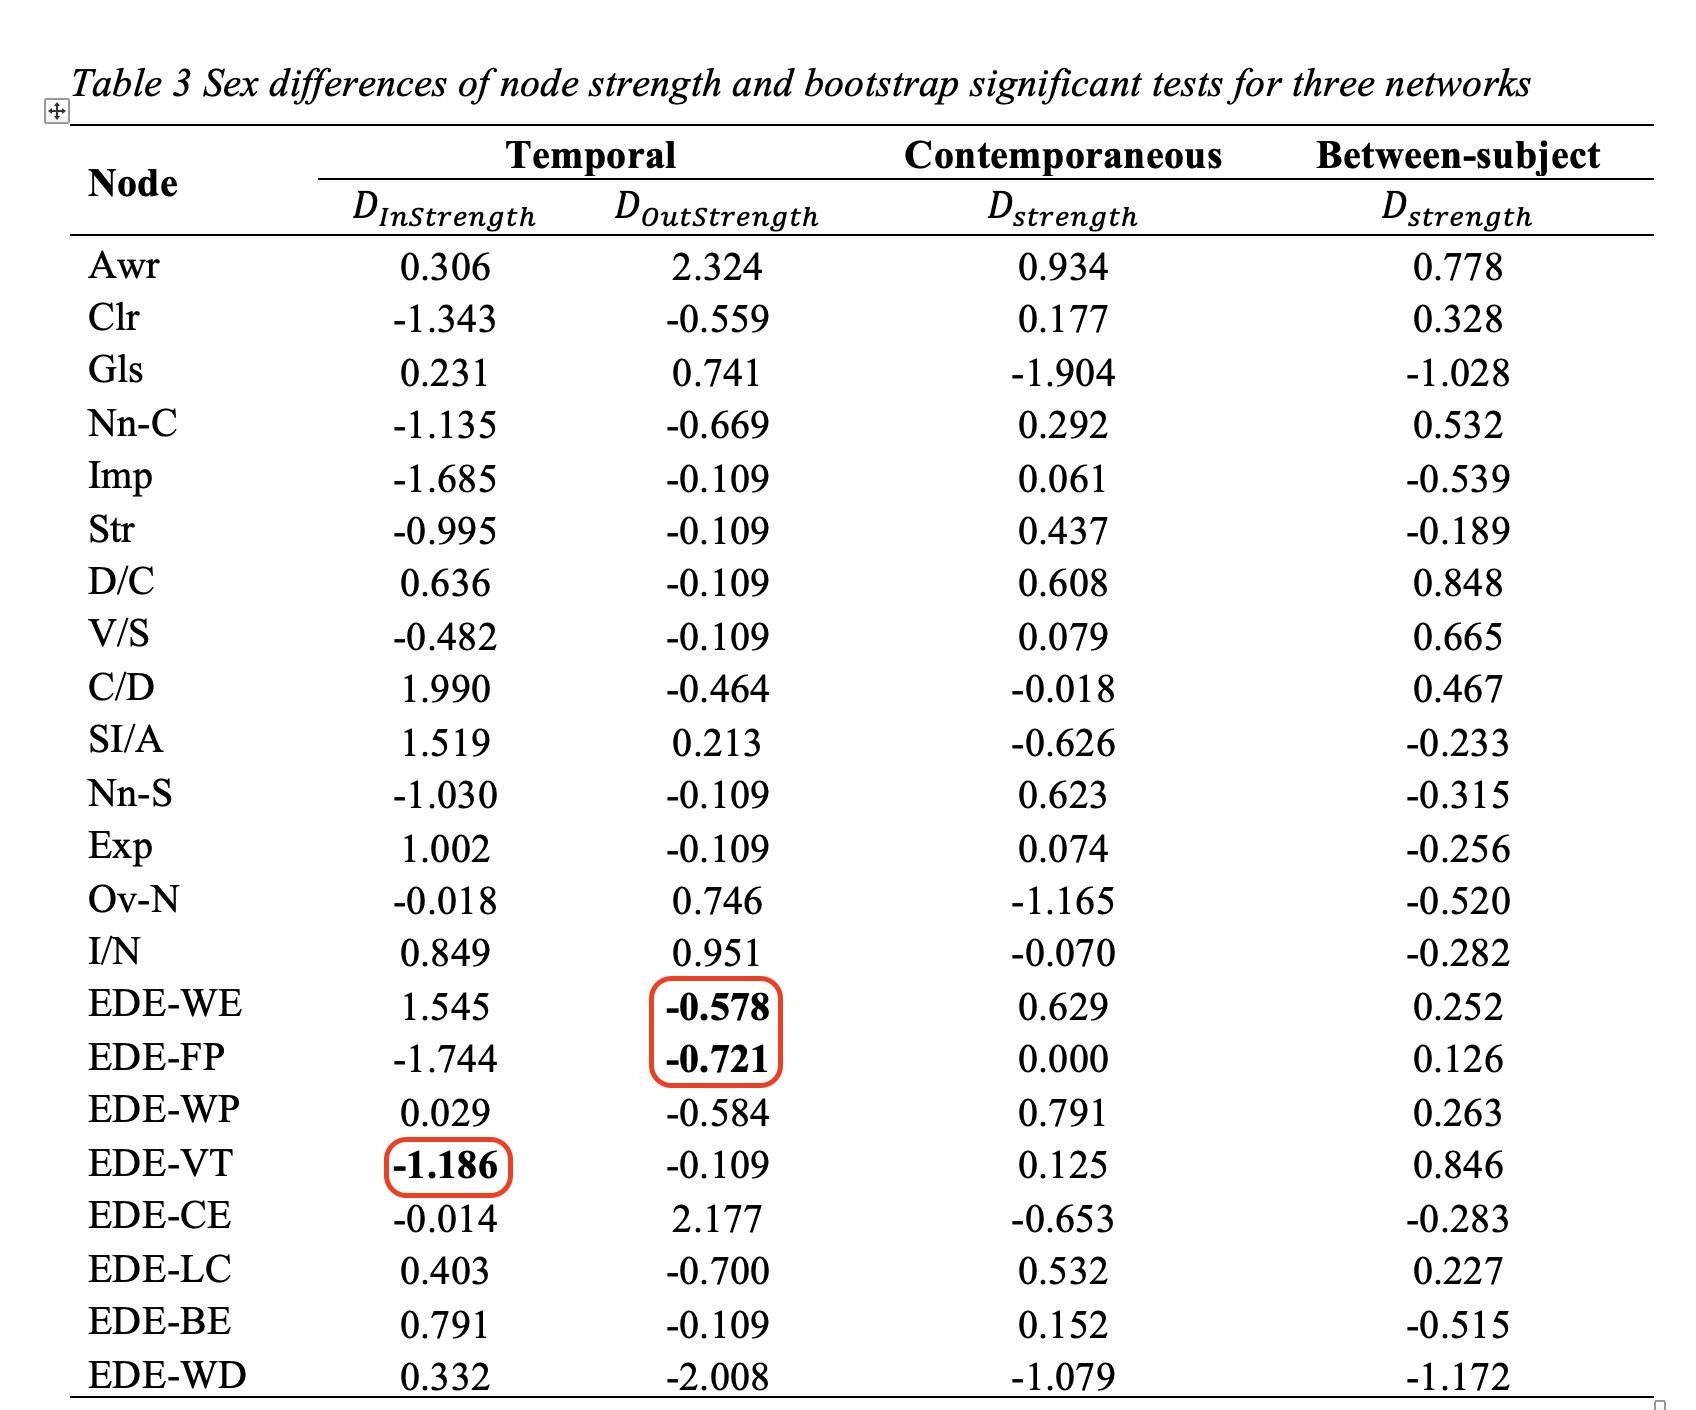
Are the node differences due to sampling error? We used bootstrapping to test this:
- Long periods without eating (EDE-WE) and Food preoccupation (EDE-FP) have significant gender differences in node out-strength.
- Weight/shape control by vomiting or taking laxatives (EDE-VT) has significant gender differences in node in-strength.
Checking which node’s bridge strength is difference
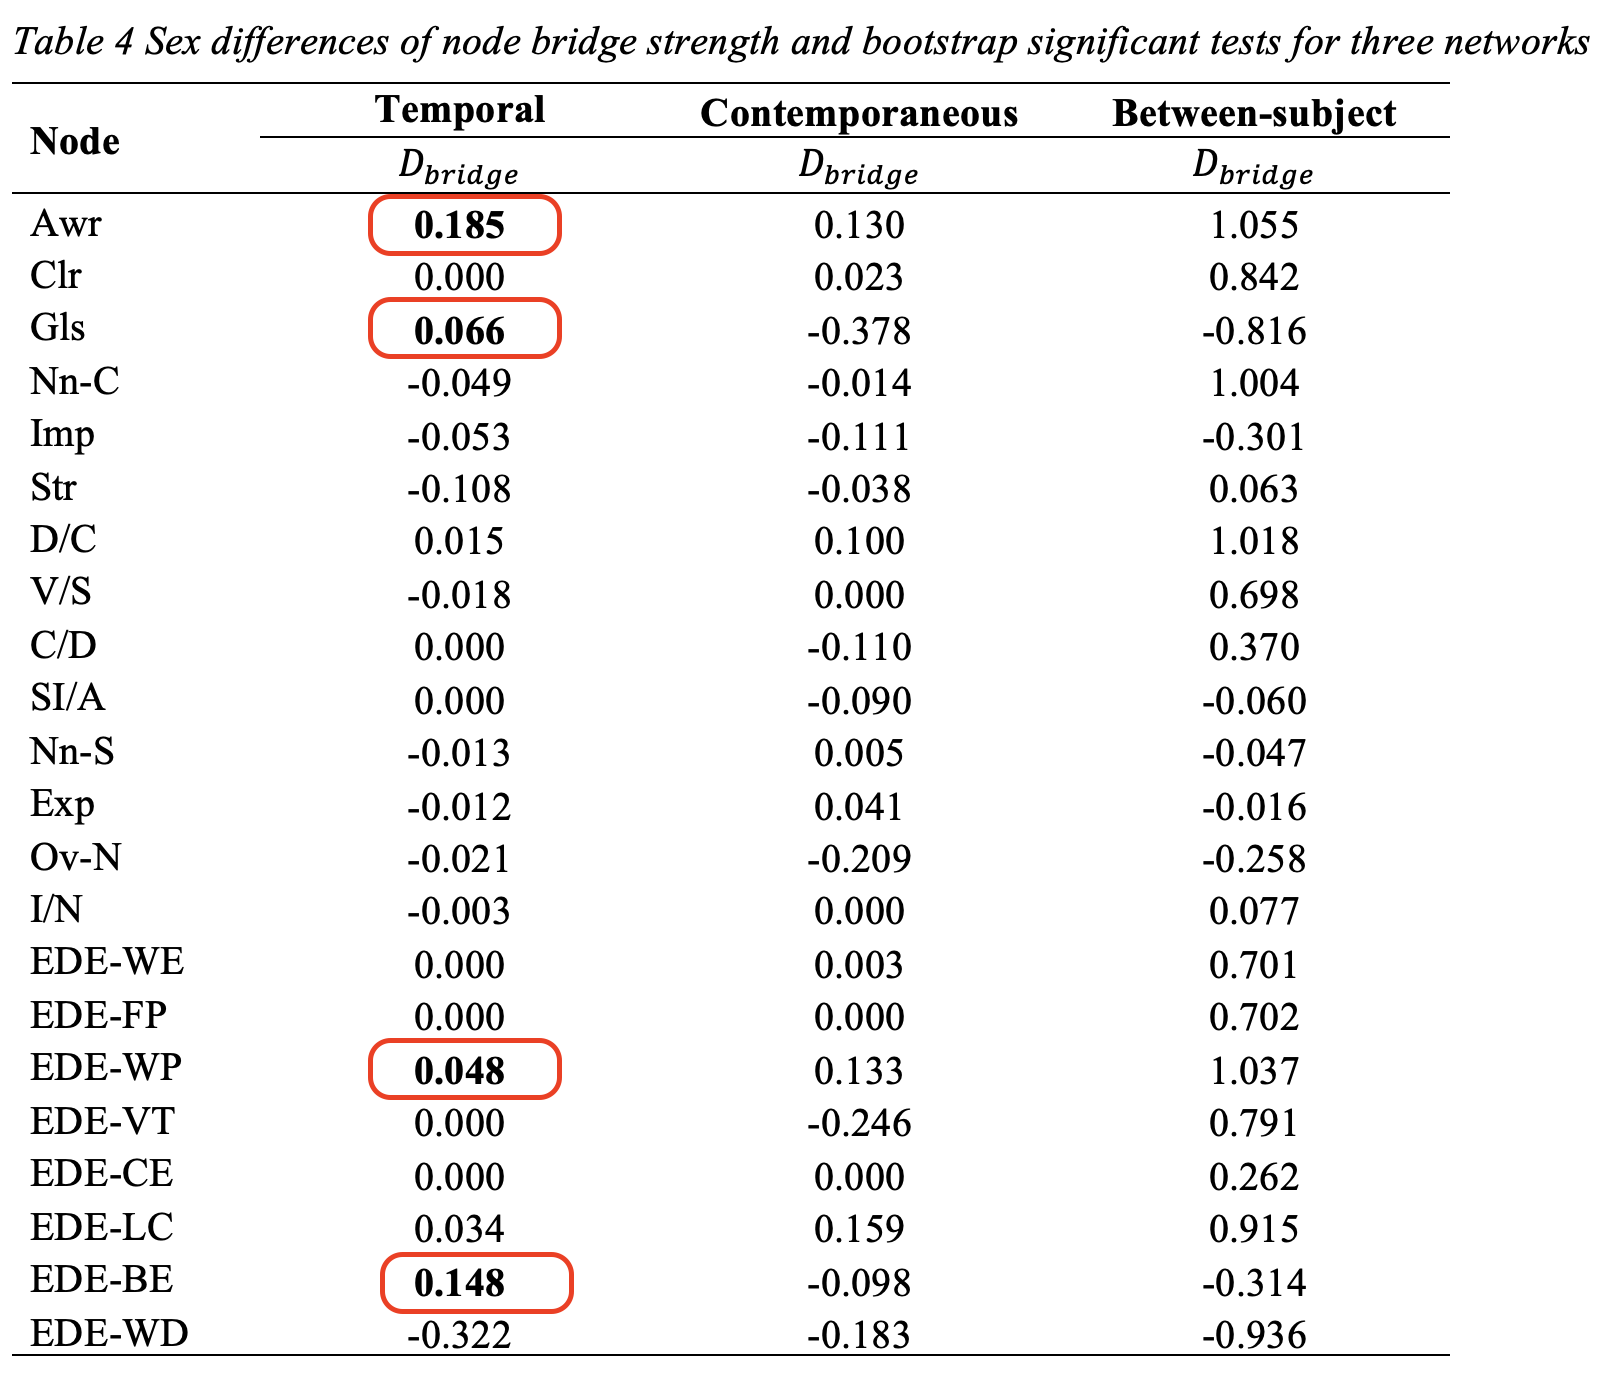
Are the node differences due to sampling error? We used bootstrapping to test this:
- Awareness (Awr) and Goals (Gls) have higher bridge strength in boys than girls.
- Weight/shape preoccupation (EDE-WP) and Binge eating episode (EDE-BE) have higher bridge strength in boys than girls.
Target nodes for intervention on comorbidity.