Network and AI-Driven Approaches in Psychometrics and Behavioral Science: Concepts and Empirical Case Studies
Department of Social and Behavioural Science, CityU, HK
2025-12-18
About me

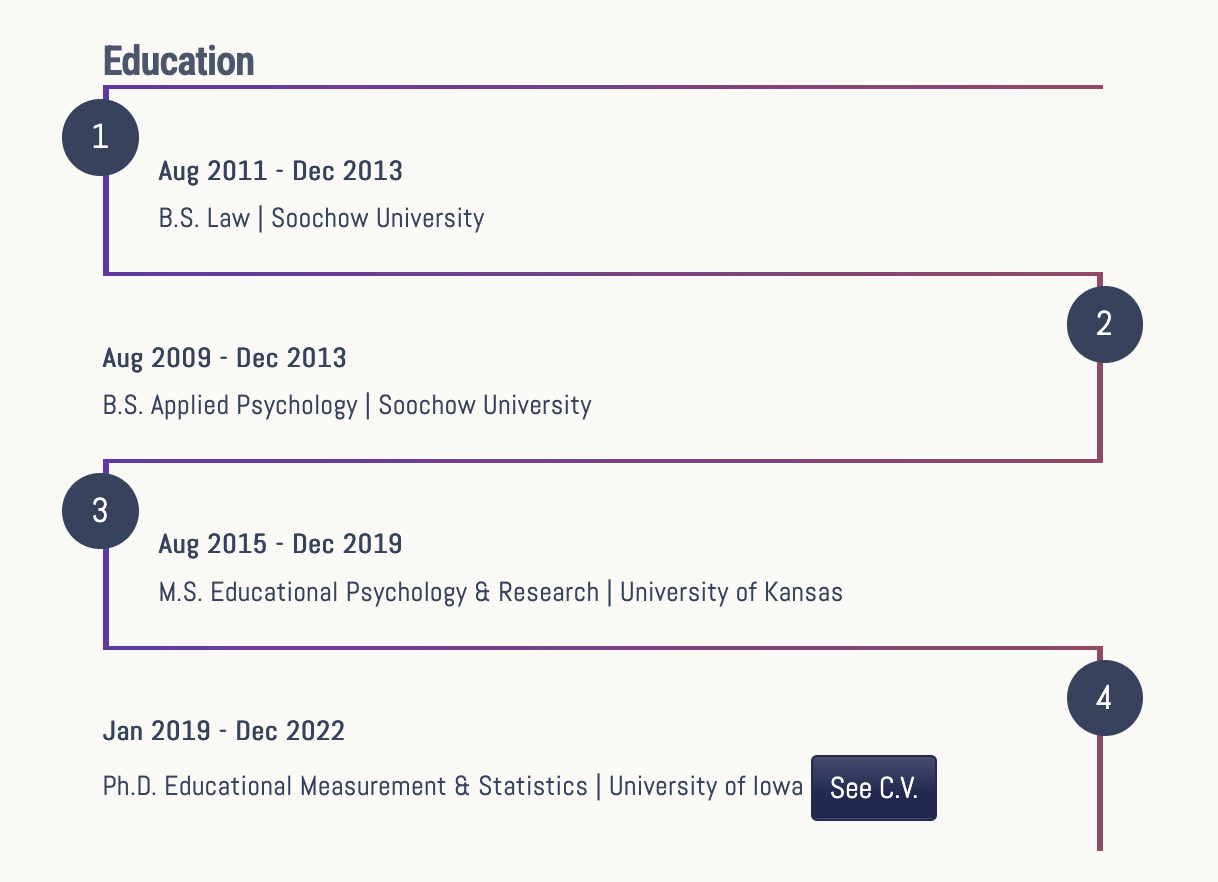
Research Path
Network Analysis in General
Network analysis is a broad area. It has many names in varied fields:
Graphical Model (Computer Science, Machine Learning)
- History: Statistical physics, such as large system of particles (Lauritzen, 1996)
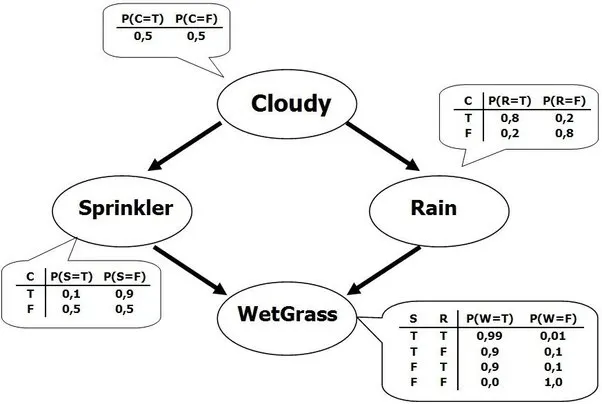
- Bayesian Network (Computer Science, Educational Measurement)
- Social Network (Sociology, Social psychology)
- Latent Factor Model or Structural Equation Model (Psychology, Education)
- Psychological Network Analysis (Psychopathology, Psychology)
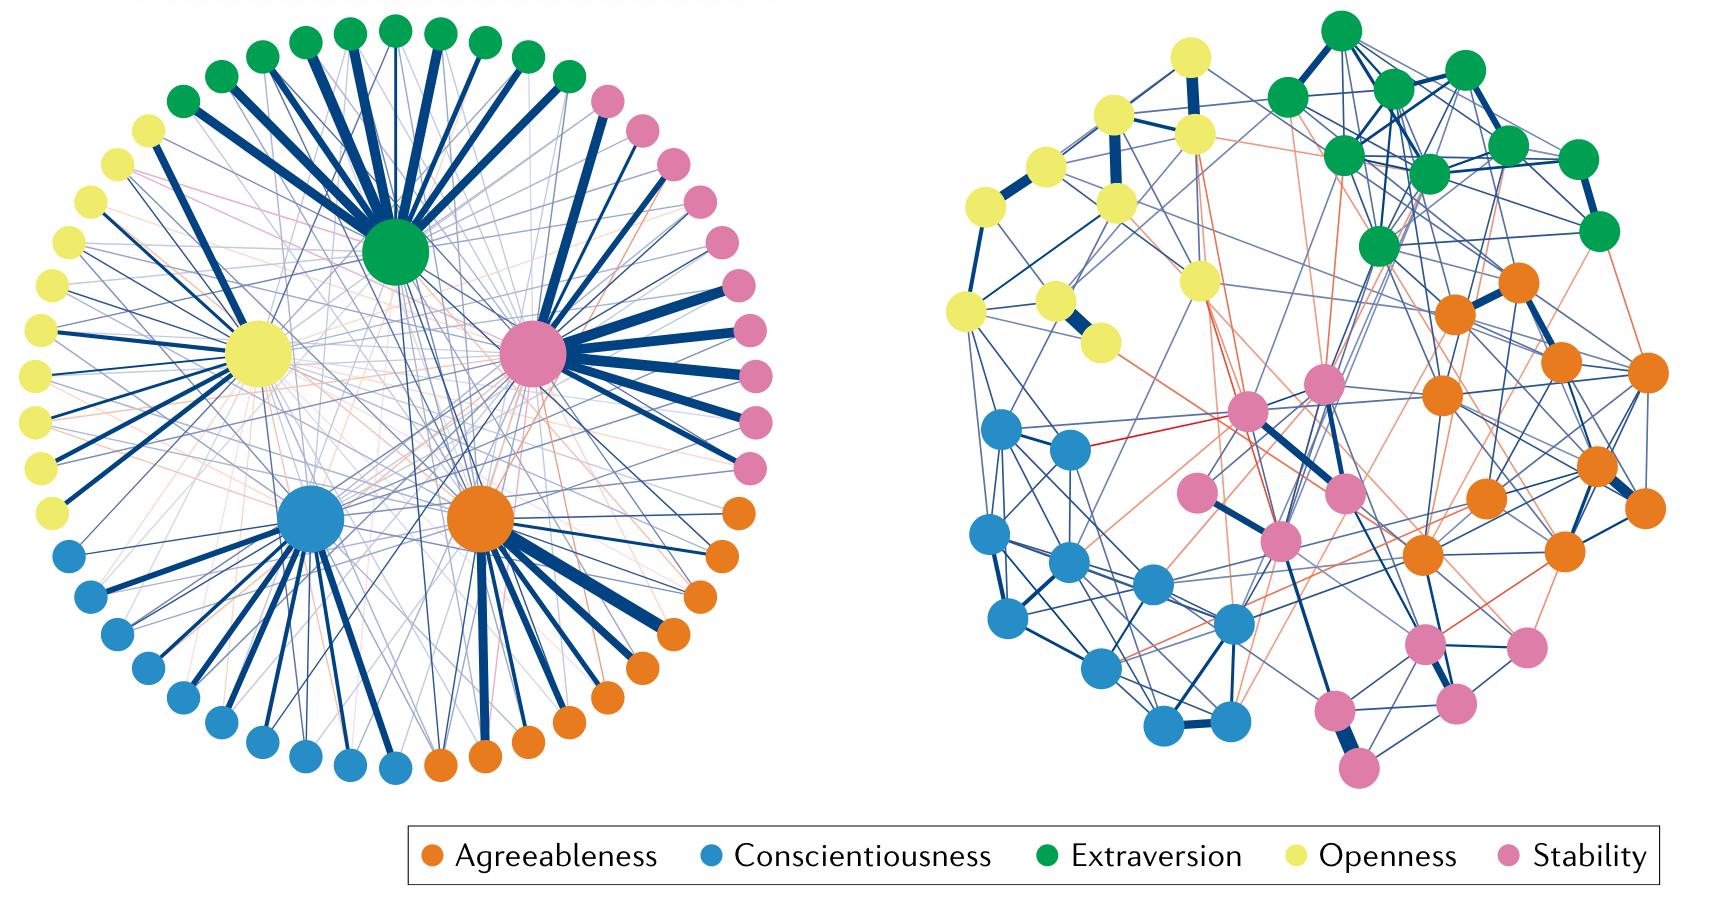
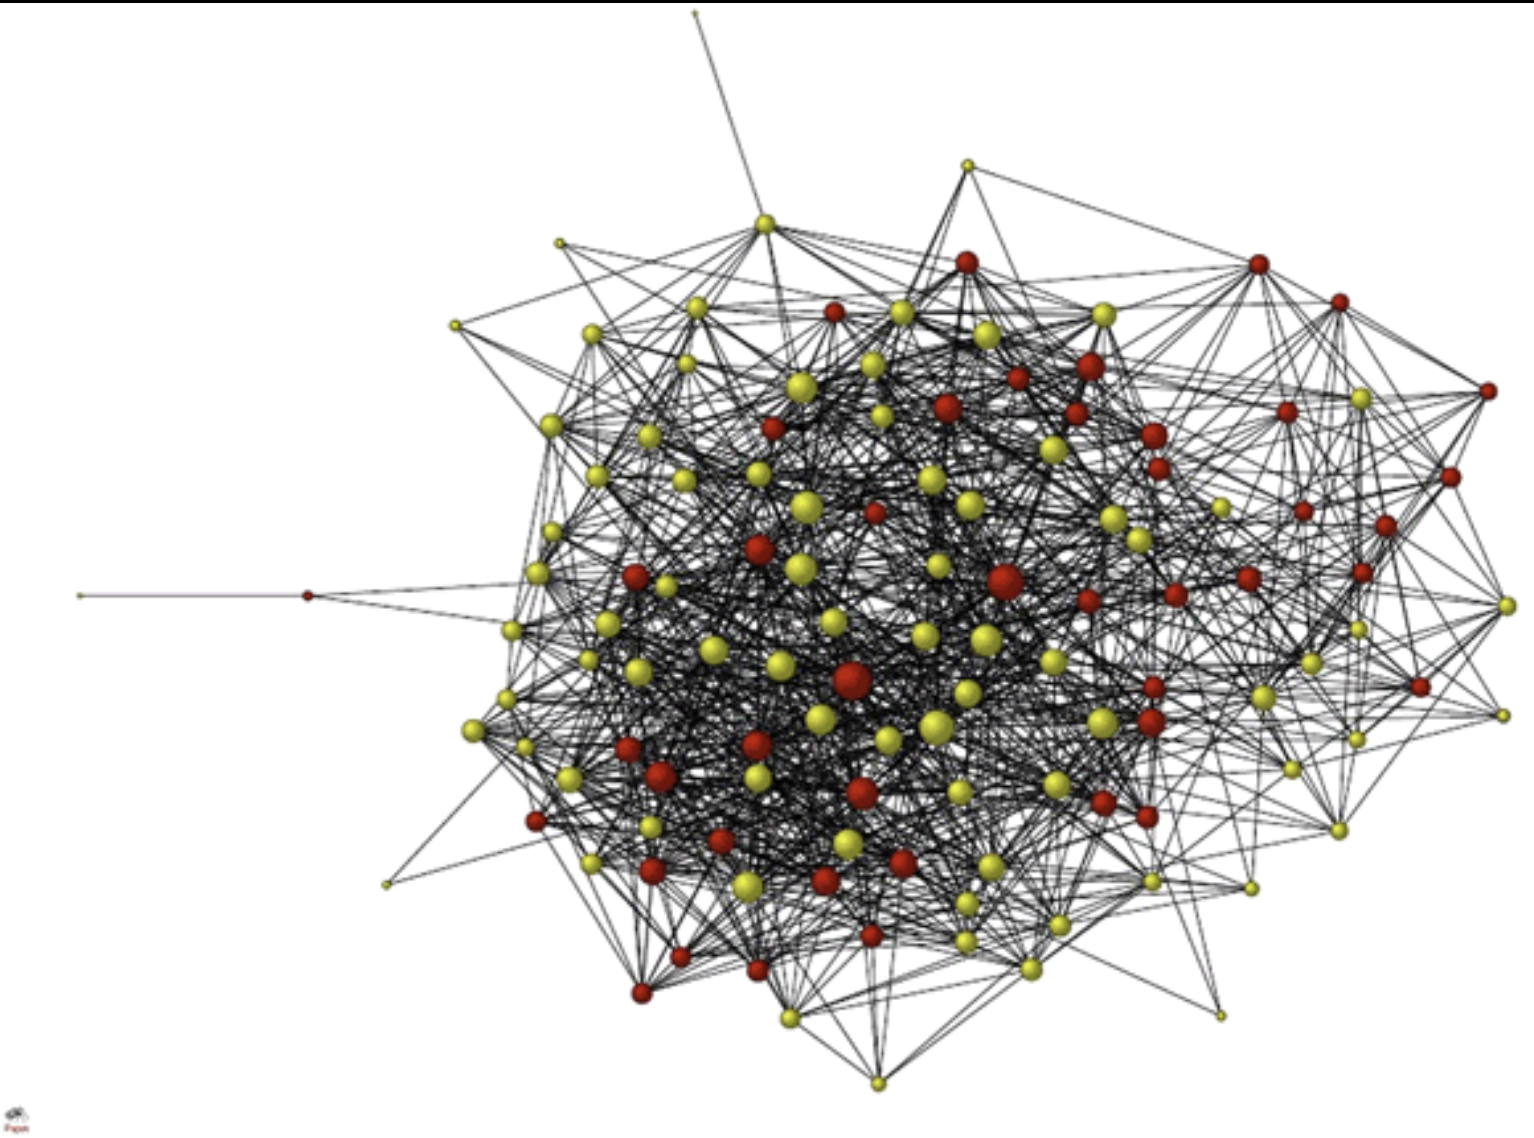
Figure 2: Exploratory factor analysis and psychological network analysis of Big Five personality (Borsboom et al., 2021)
Psychological Networks and Network Psychometrics

Network psychometrics is a novel psychometric area that represents complex phenomena of measured constructs as sets of elements that interact with each other (Isvoranu et al., 2022).
It is inspired by the mutualism model and research in ecosystem modeling (Kan et al., 2019).
- The mutualism model proposes that basic cognitive abilities directly and positively interact during development.
In recent years, interest in psychological networks as dynamics or reciprocal causation among variables receive more attention.
Latent Factor Model VS. Psychological Network Model
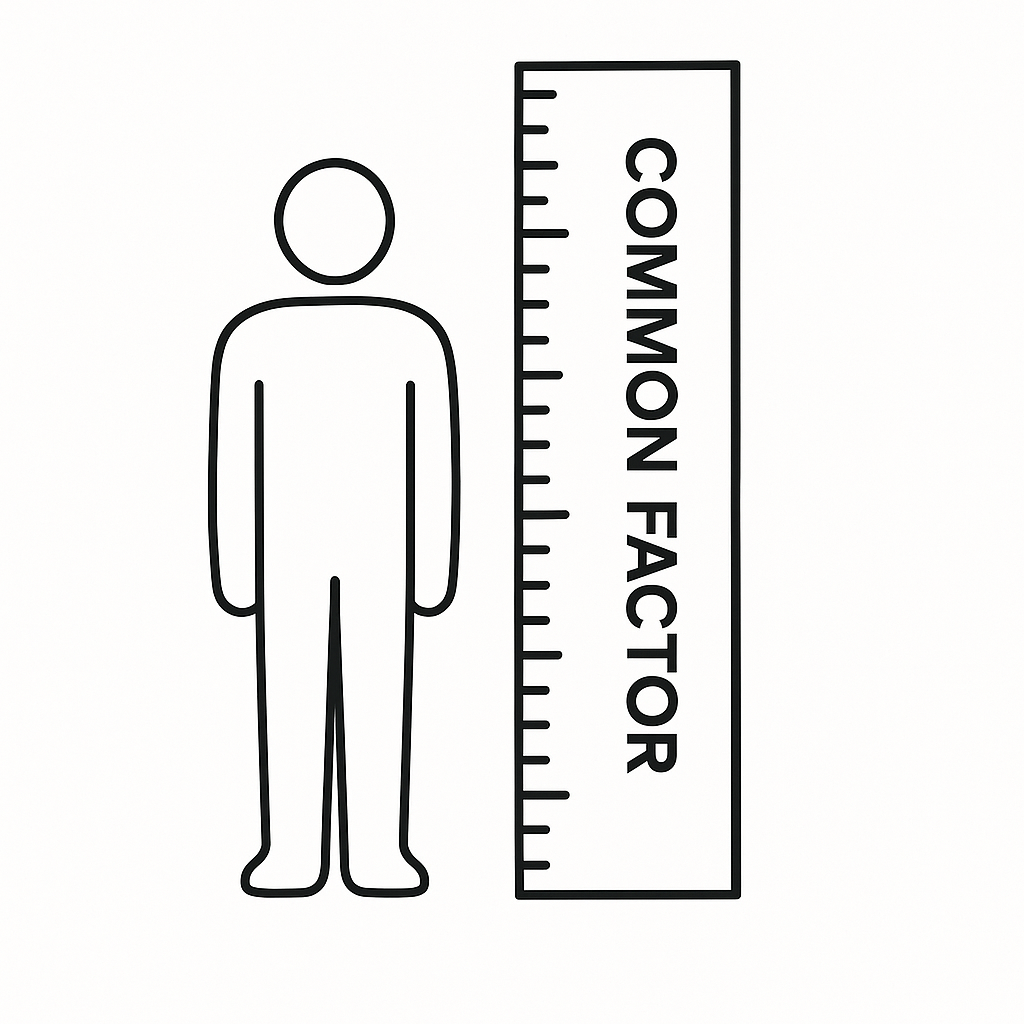
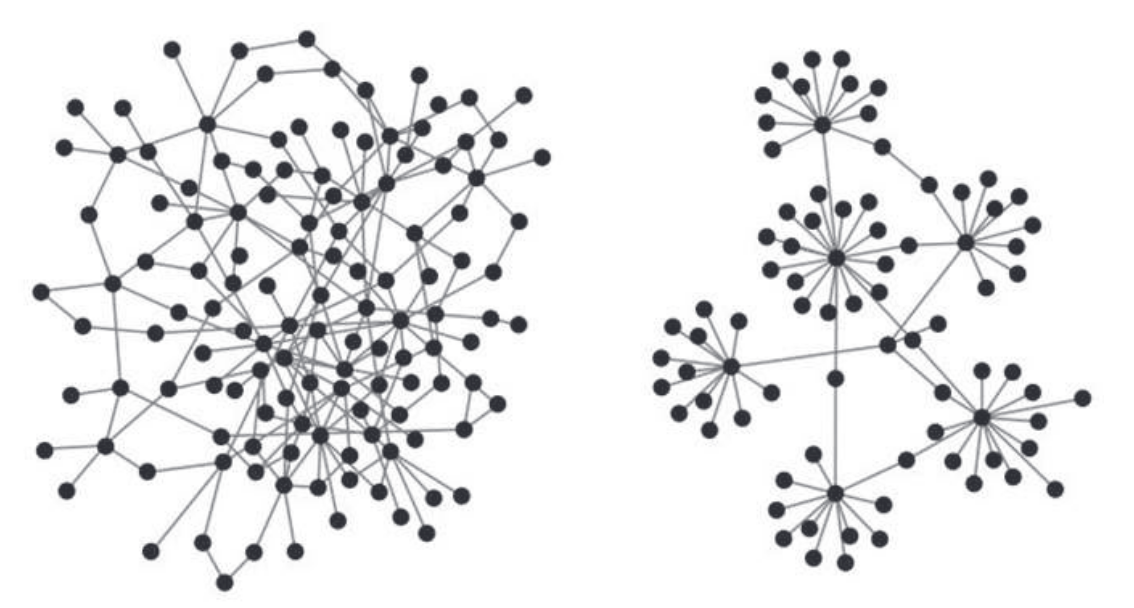
Latent factor model (common factor model) assumes that associations between observed features can be explained by one or more common factors (e.g., agreebleness, conscientiousness).
Psychometric networks, however, assume that associations between observed features are the reason for the development of one system. In this view, “personality” is the network itself.
Exploratory factor analysis and psychological network analysis of Big Five personality (Borsboom et al., 2021)
Common factor or Mutualism?
“Openness” dimension:
- Q5 (Creativity). … comes up with new ideas: Disagree (1) to Agree (5) 1
- Q10 (Curiosity). … curious about lots of different things: Disagree (1) to Agree (5)
Does “openness” really exist?

Research aims: Density, Centrality, Pathways, and Group Differences
Aim 1. Network Density
Assess overall connectivity and sparsity (system activation likelihood)
Aim 2. Identify Pathways
Map symptom interactions and feedback loops (A ↔︎ B ↔︎ C ↔︎ A) 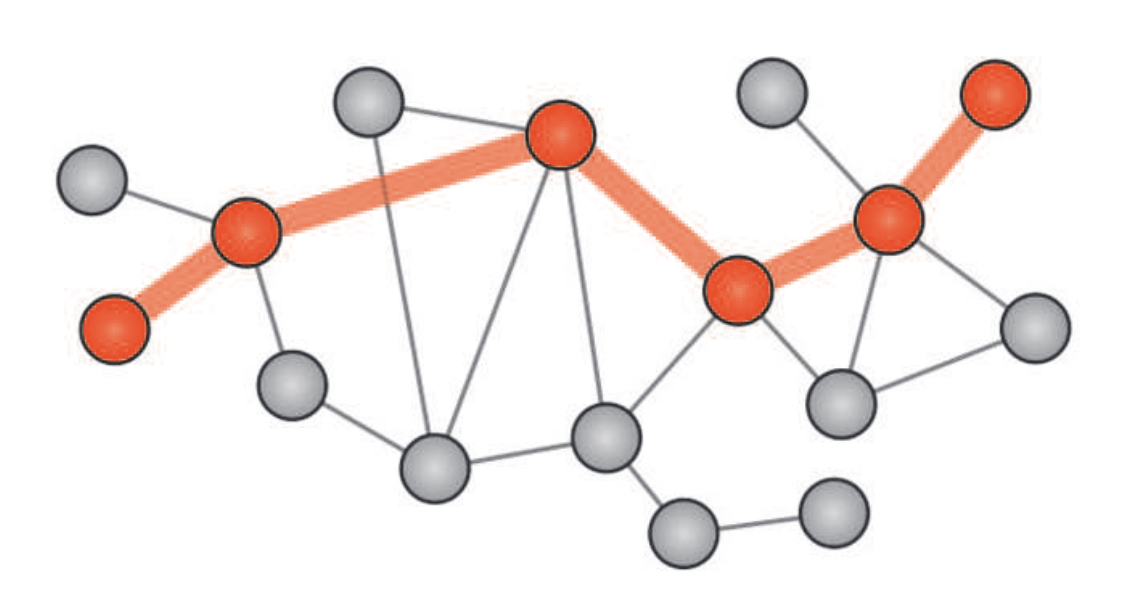
Aim 3. Intervention Targets
Identify the most central/influential nodes for treatment
Aim 4. Group Differences
Compare network structures across populations
These analytical goals help bridge theory and practice, guiding both our understanding of psychological phenomena and clinical decision-making.
Data types: Cross-sectional vs. Longitudinal network
Cross-sectional network
- Data: Multivariate cross-section data
- Model: Gaussian graphical model (GGM)
- Dependence: The variables depend on other variables at the same time
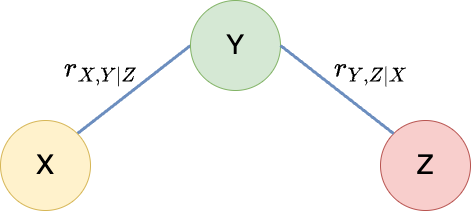
- Edge Statistics: Partial Correlation (\(r\))
- Methodology: Correlation analysis
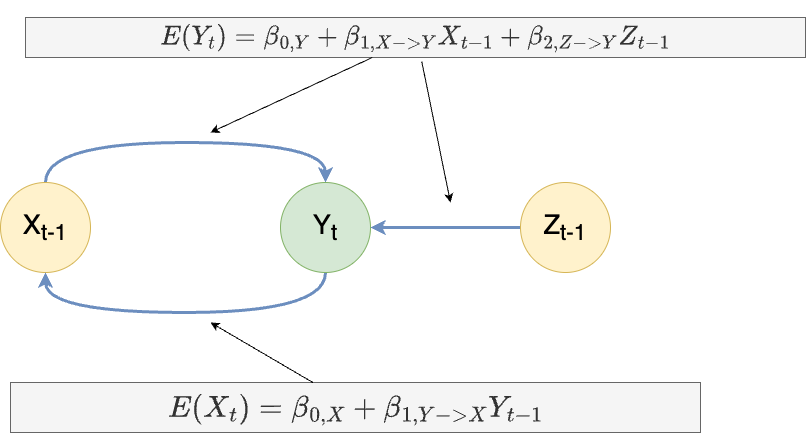
Longitudinal network (today’s focus)
- Data: Multivariate time-seires data
- Model: Graphical vector autoregressive (VAR) model
- Dependence: The values of the variables at time \(t\) depend linearly on the values at time \(t -1\)
- Edge Statistics: Lag-1 regression coefficient (\(\beta\))
- Methodology: Granger-causality
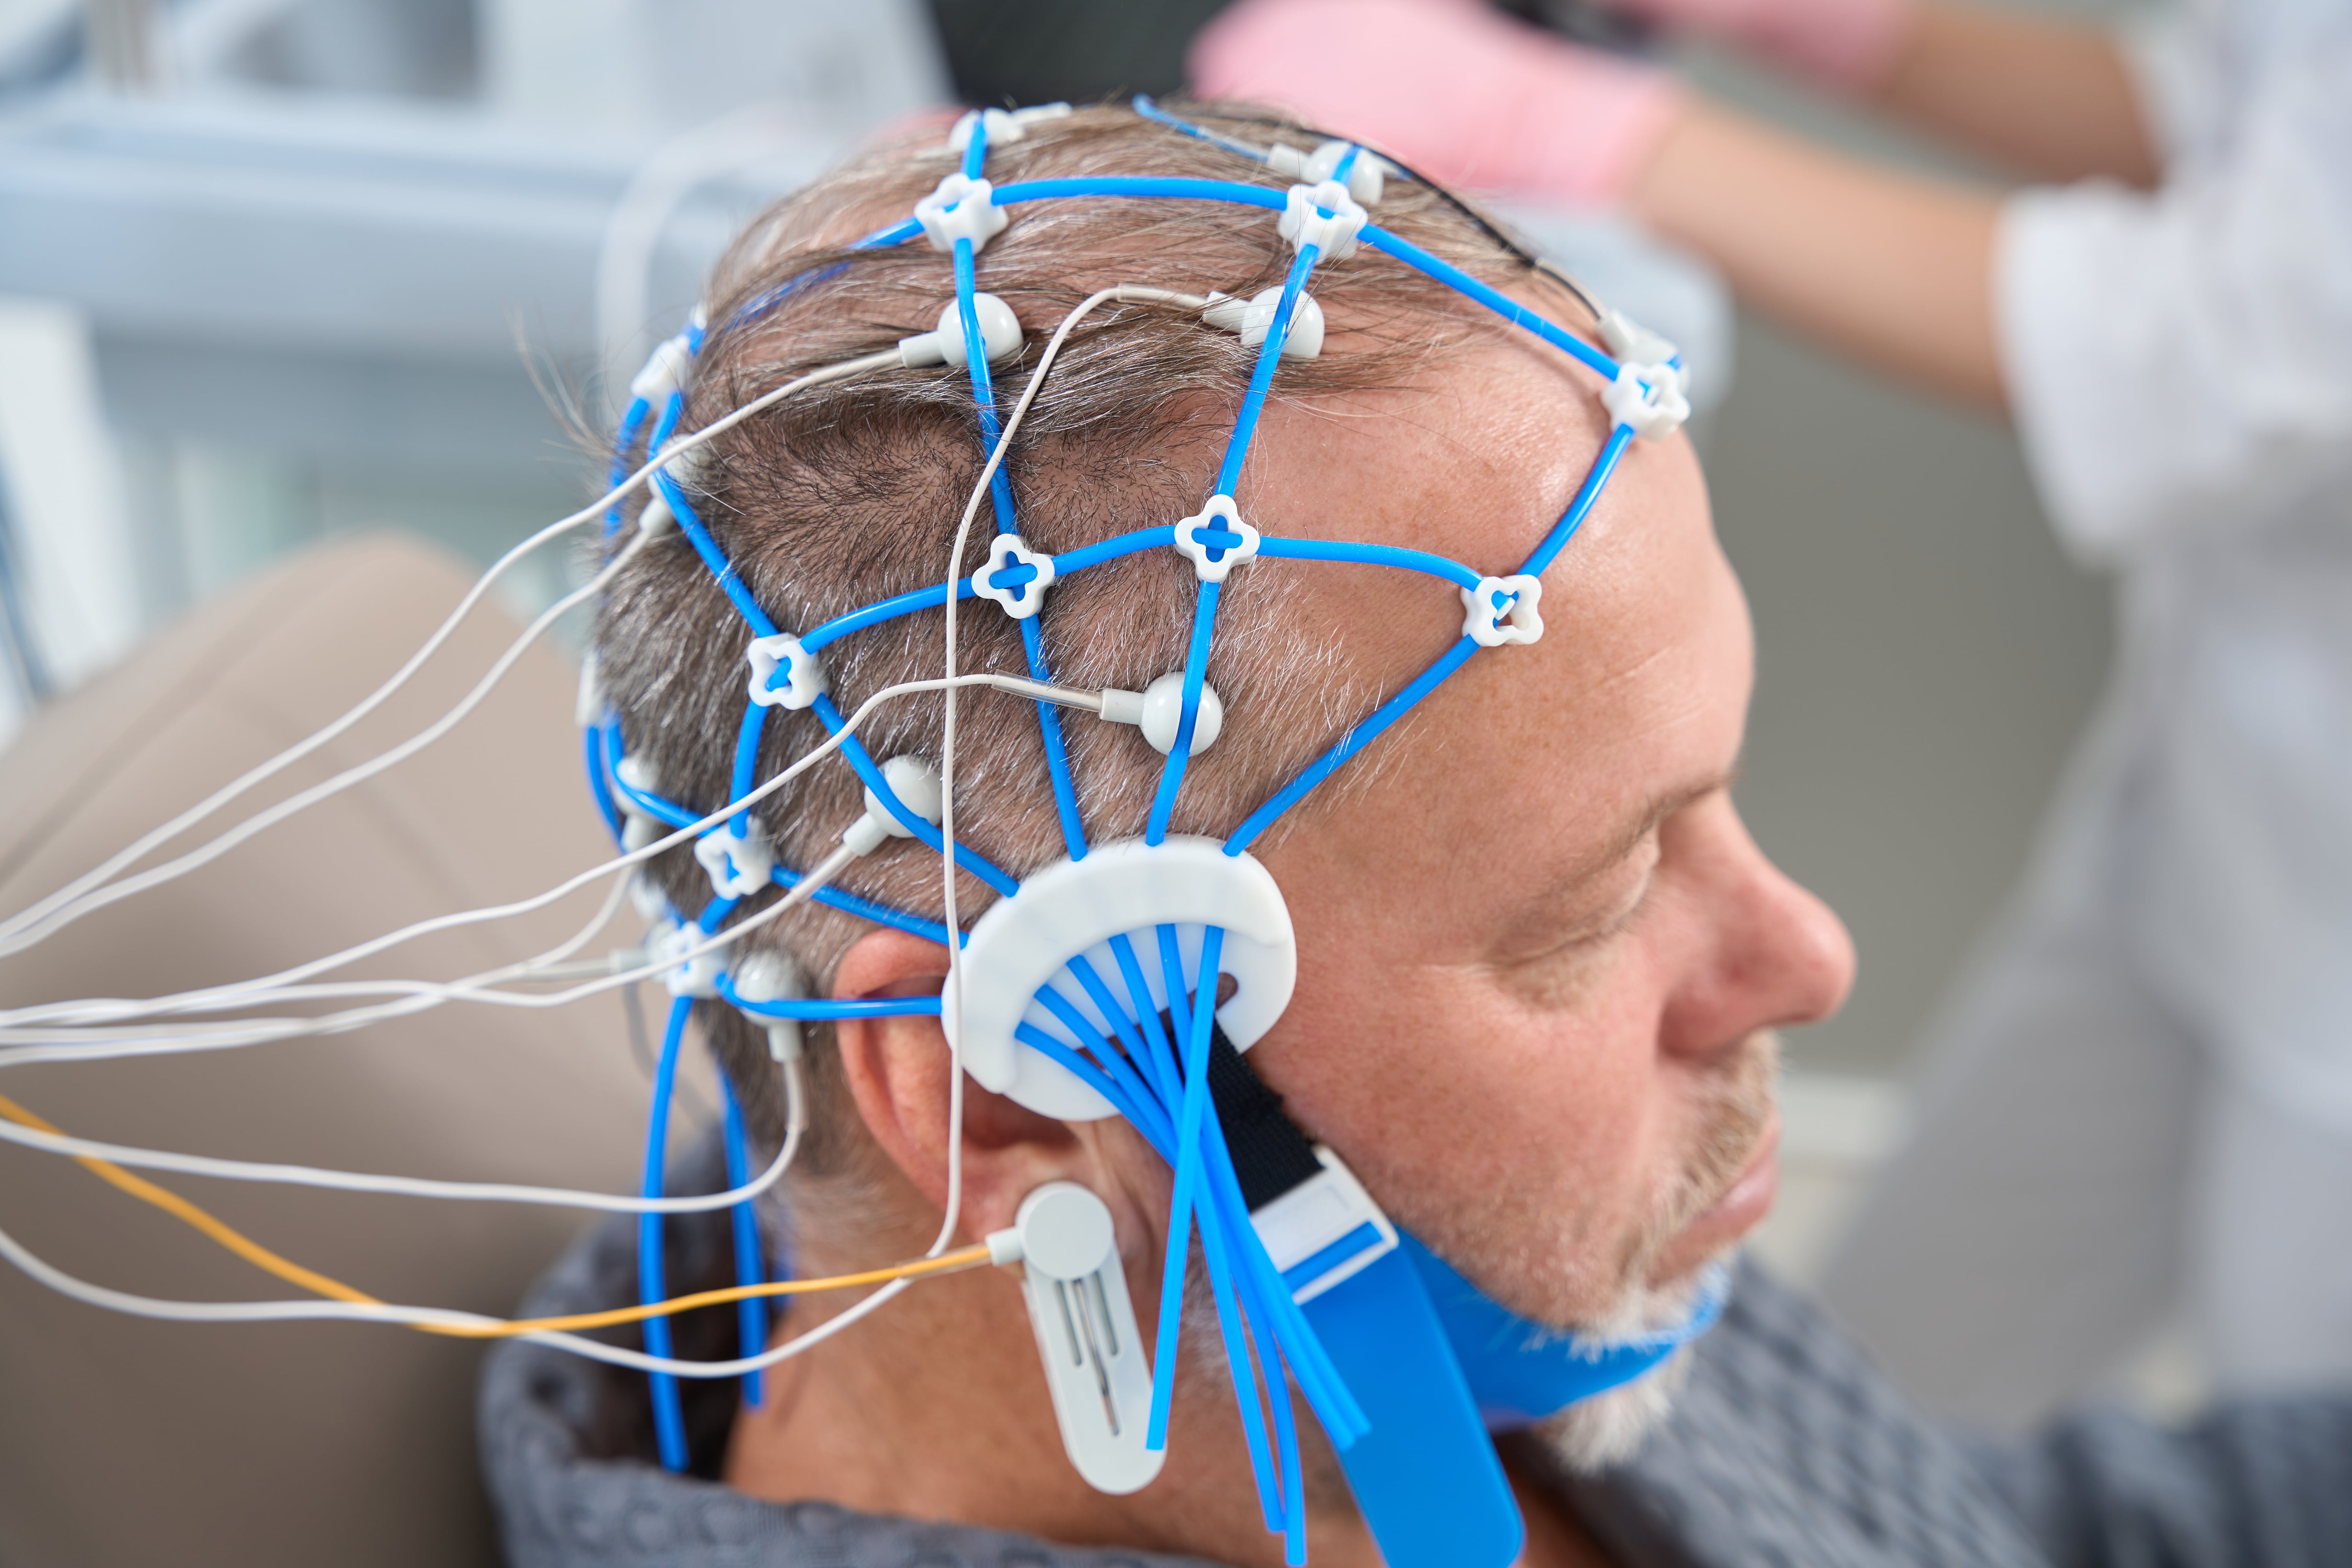
3 Case Study 1: A longitudinal Electroencephalography (EEG) network analysis
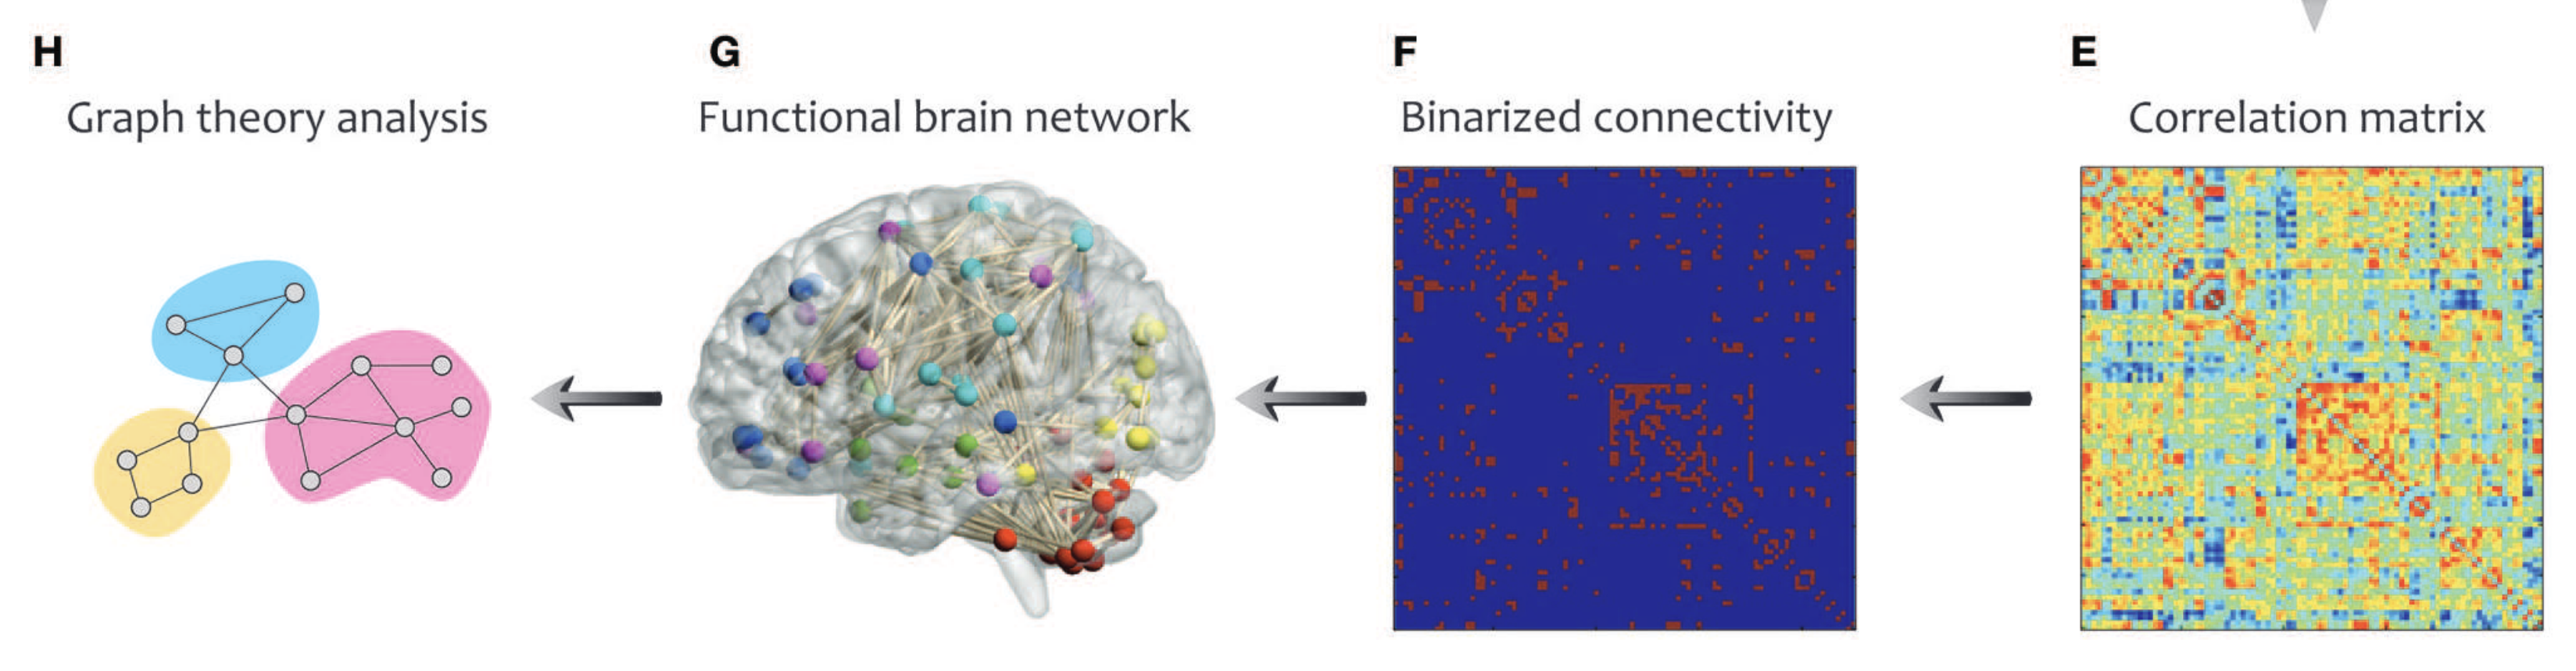
Brain Activity Networks
The human brain is one of the most complex networks in the world.
– Farahani et al. (2019)
Data
Sample: 19 participants completed 8 weeks of FA training with 3 visits per week, resulting in 24 sessions.
Training: in each session, they completed 20-minutes of standardized audio-guided Focus Attention meditation practice. EEG data was collected
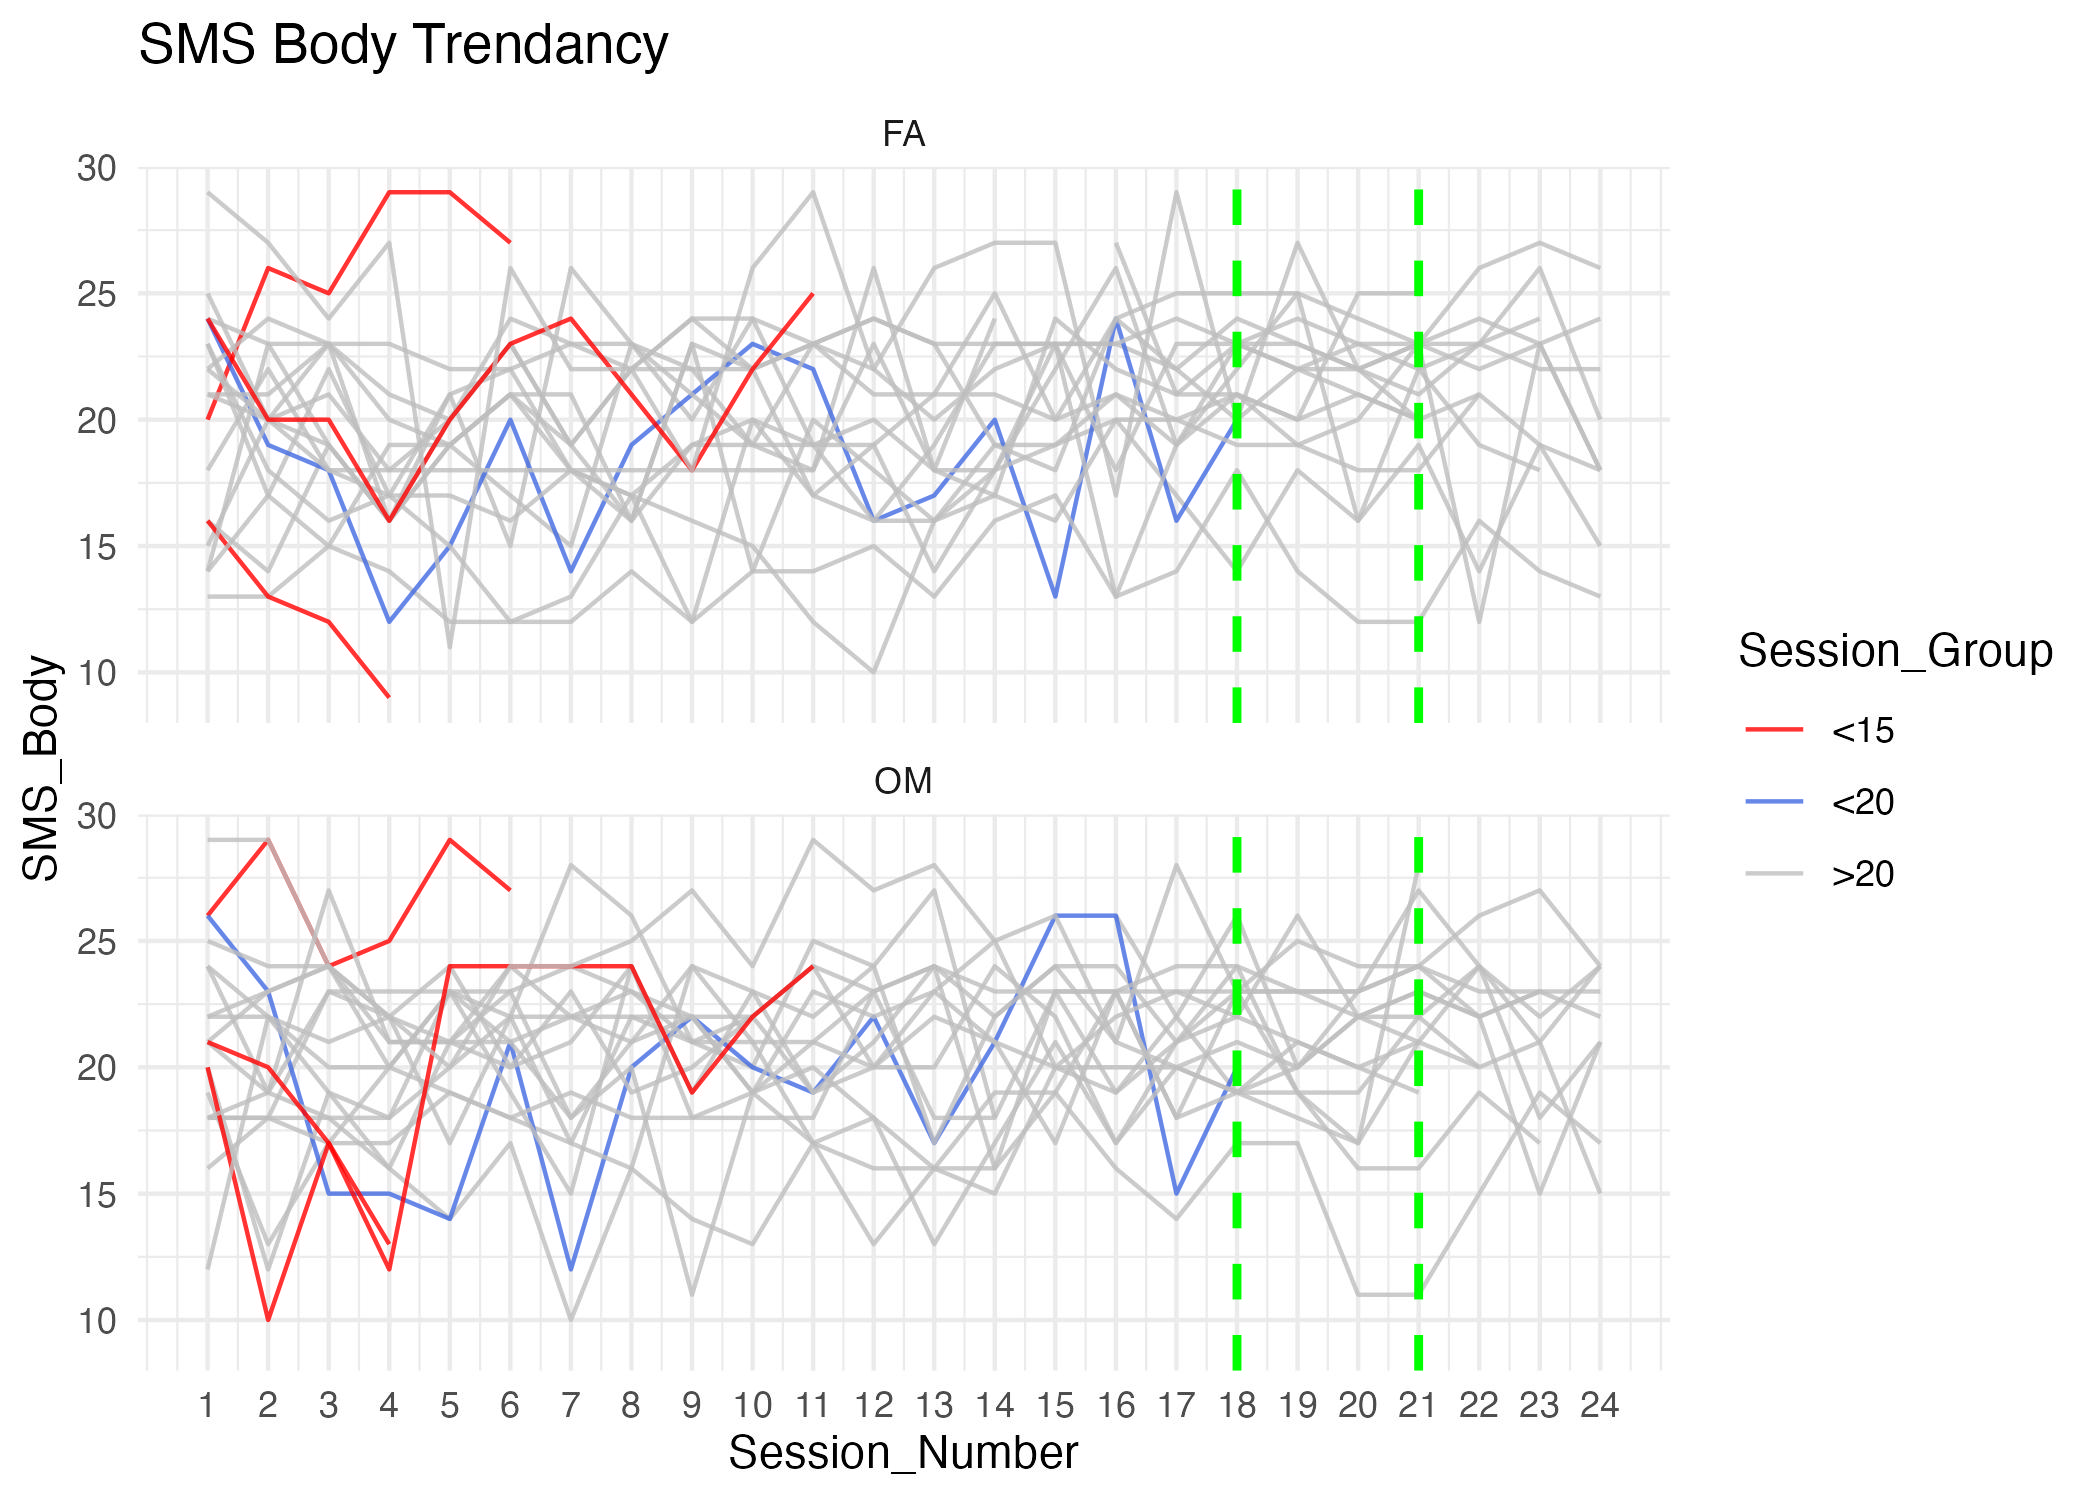
Measure: Self-reported State Mindfulness Scale (SMS_Mind) and body (SMS_Body)

Results: regularization
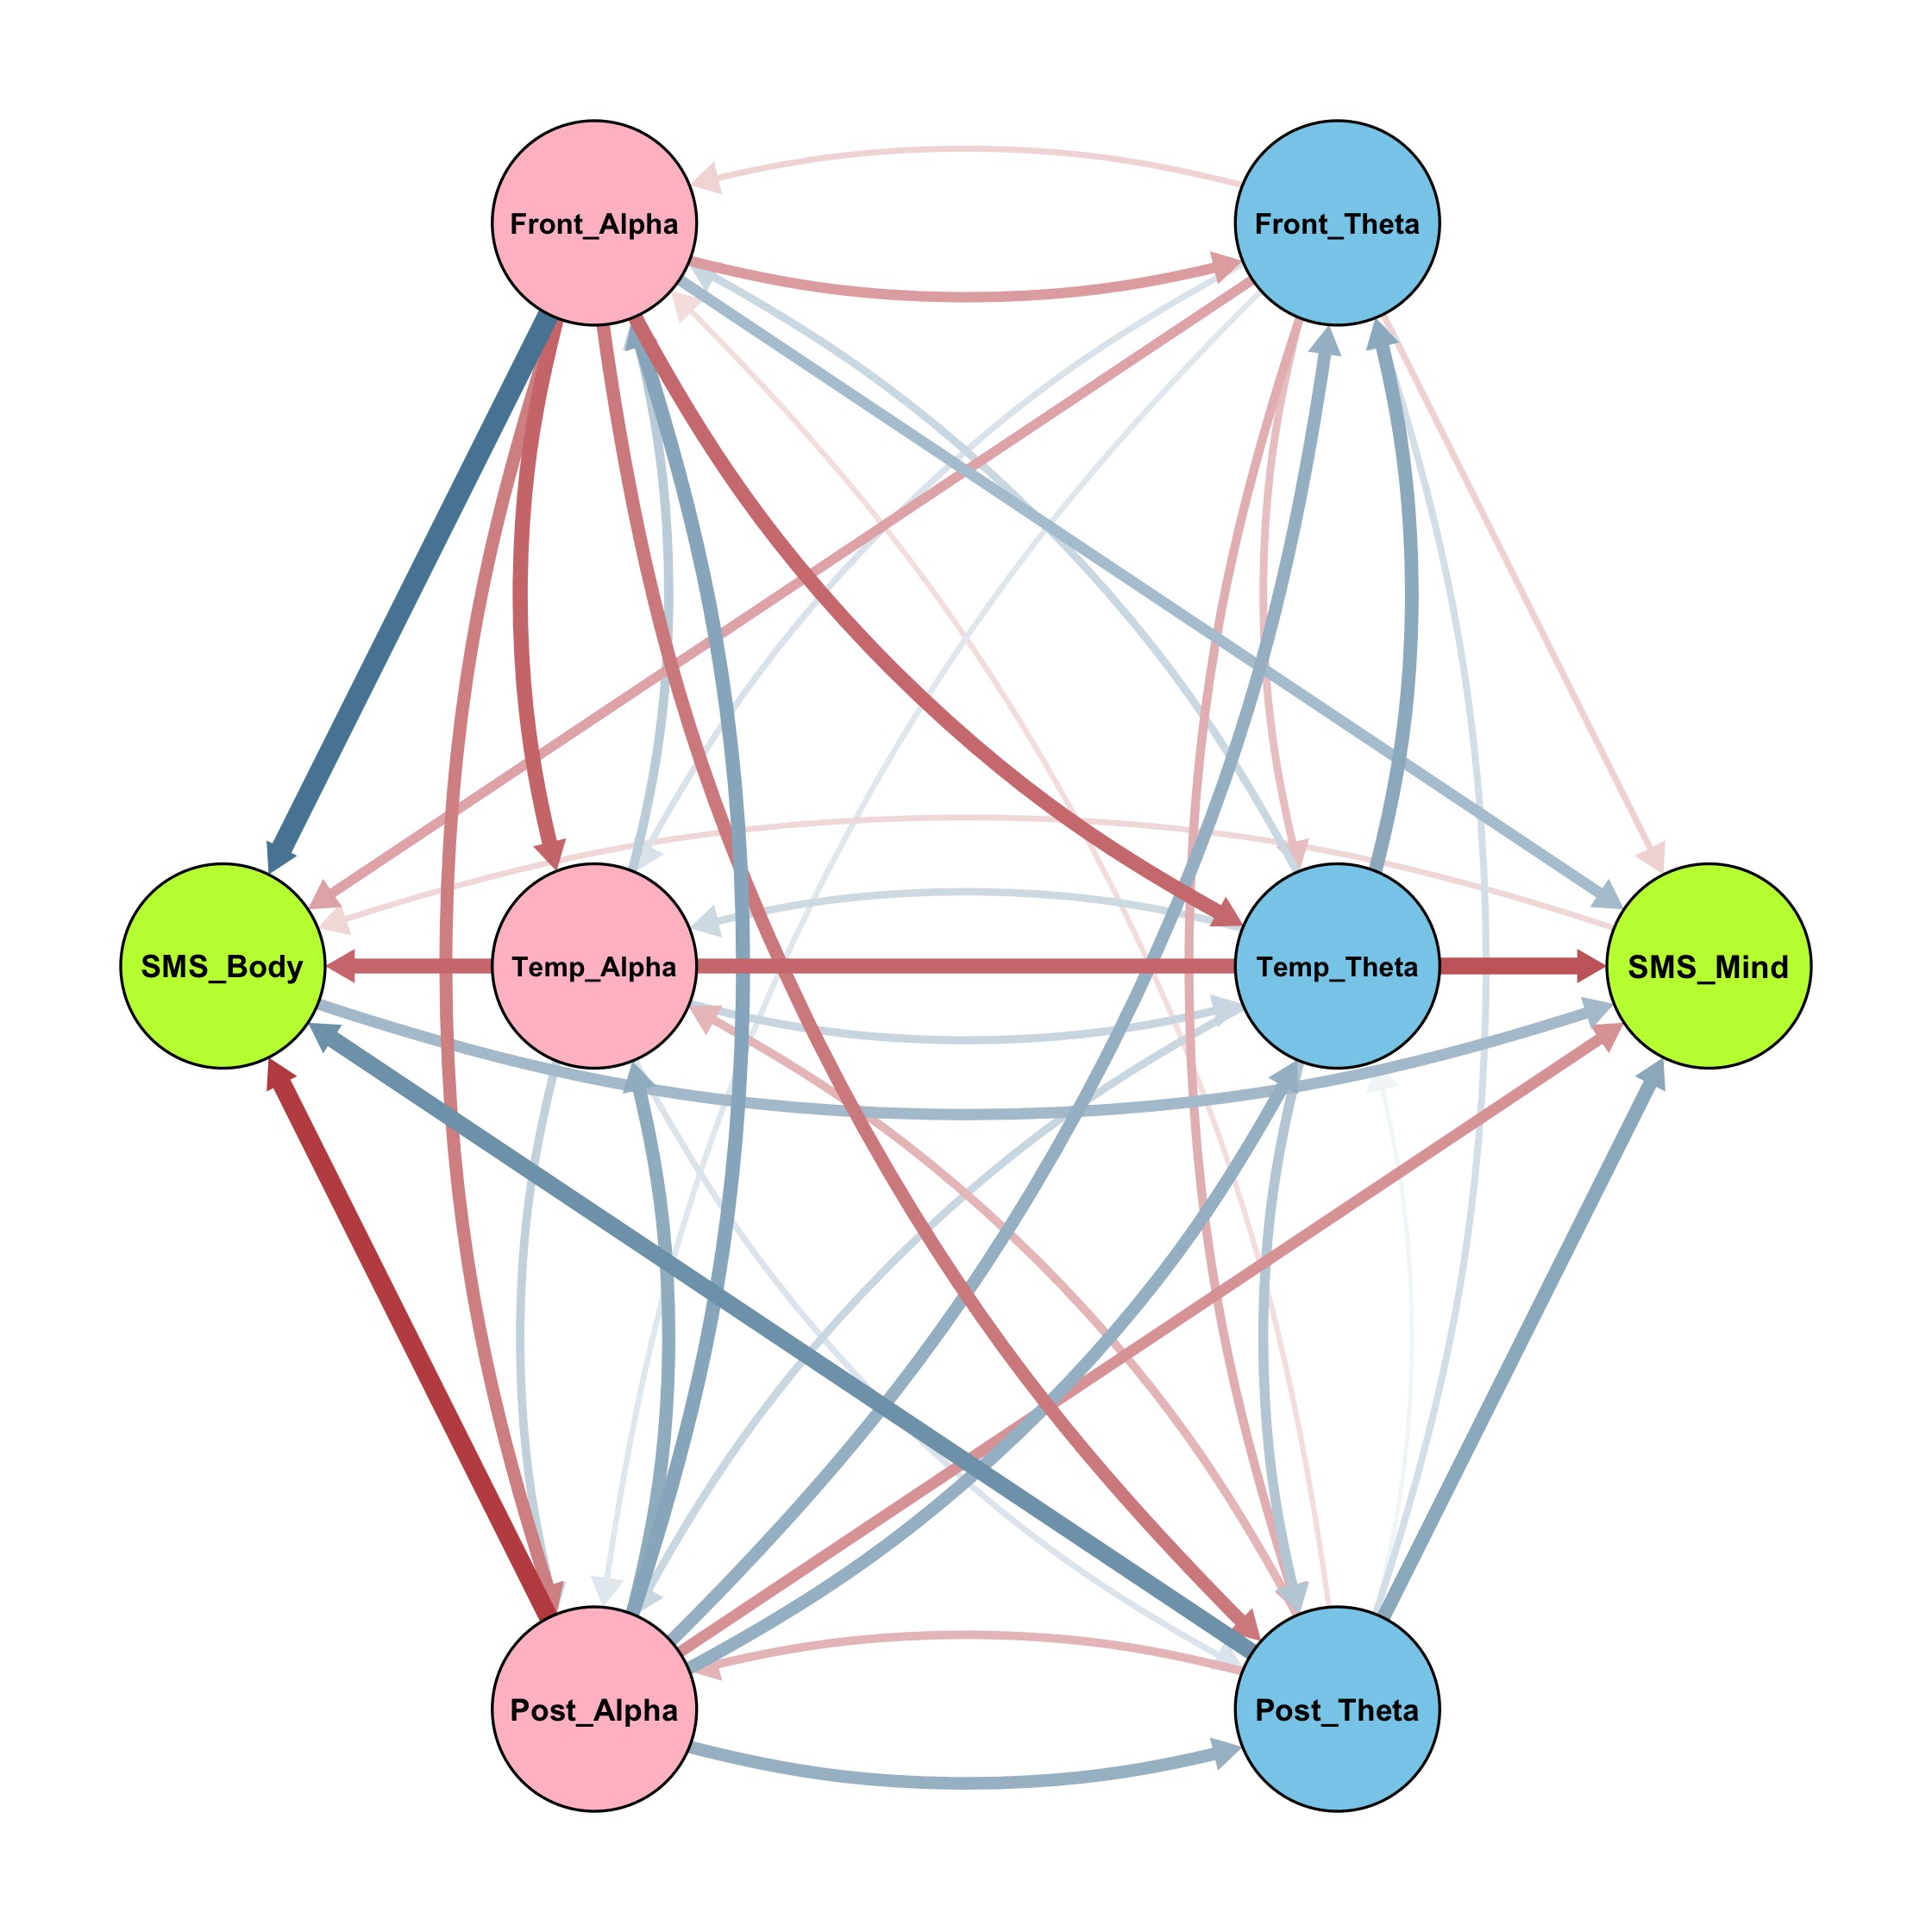
Unregularized psychological network
Regularized psychological network
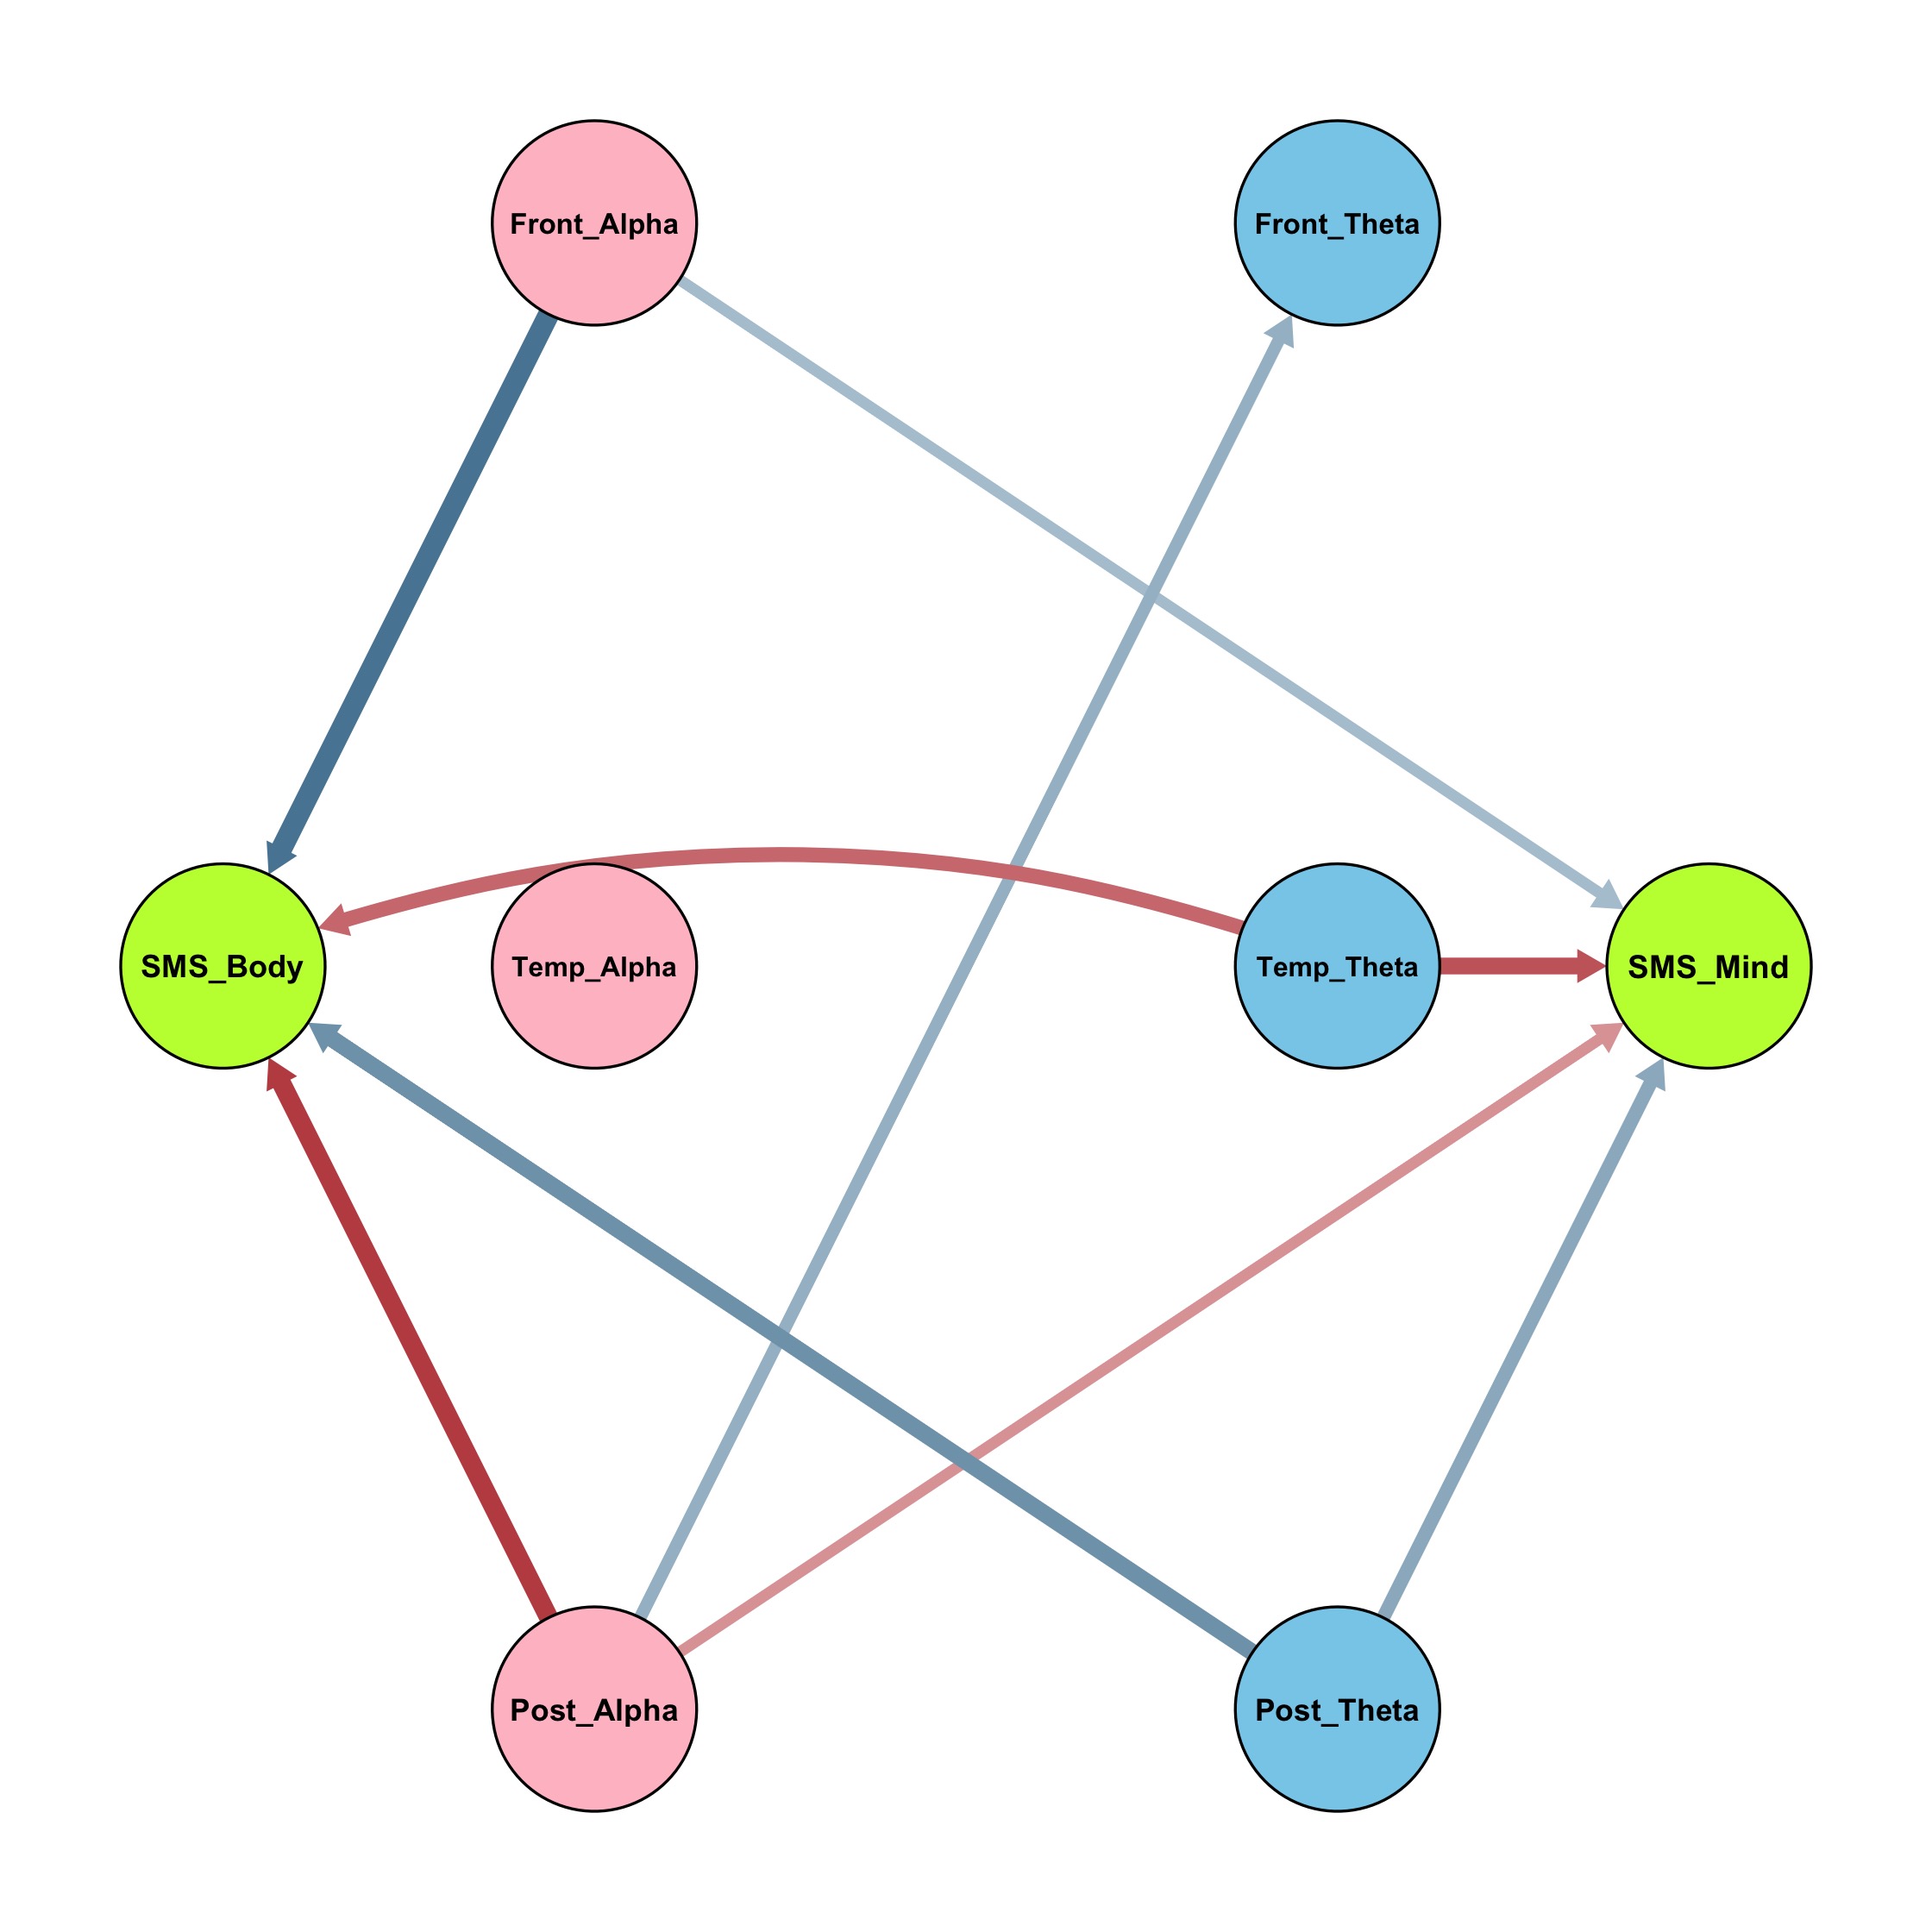
Alpha power; Theta power; Self-report mindfulness
Discussion
Brain is dynamical
- e.g., Posterior alpha can enhance frontal theta over time
Brain region (topography) matters
e.g., Frontal alpha power enhances mindfulness, while posterior alpha power suppresses mindfulness of body and mind over time.
e.g., Posterior theta power enhances mindfulness, while temporal-central theta power suppresses mindfulness
Identify ideal brain states
- e.g., According to centrality measures, frontal alpha and posterior theta are most important EEG signal for FA meditation training.
Research background
The present study examined sex-specific, symptom-level relationships among emotion regulation (ER), interpersonal problems (IP), and eating disorder (ED) psychopathology in a large sample of Chinese adolescents (Zhang et al., 2024).
Background: Eating disorders are serious issues for college students. The eating disorders symptoms are dangerous and co-occur with other psychological issues.
Motivation: Given the complex relationships between eating disorders with other risky behaviors, we need a novel model to untangle those interplay which can help with further intervention.
Assumption: Eating disorders combined with other risky factors be considered a network?
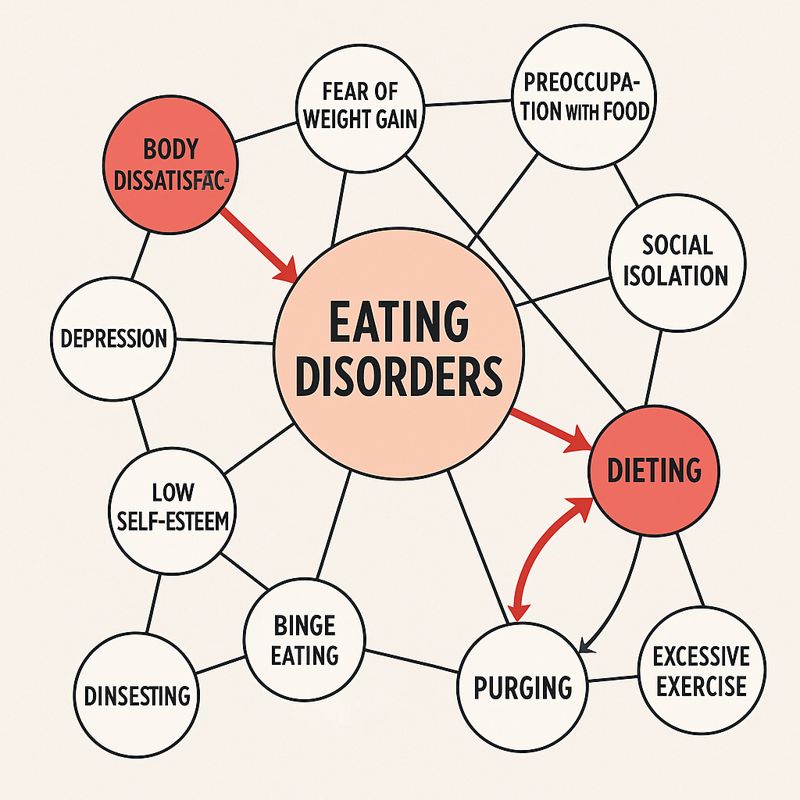
Eating Disorder Network?
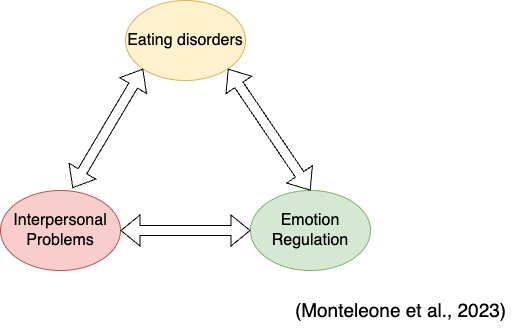
Interrelationships among components—emotion regulation, interpersonal problems, and eating disorders:
Emotion regulation theory suggests that difficulties in emotion regulation can result in ED behaviors.
Interpersonal psychotherapy theory posits that interpersonal problems may exacerbate ED (Murphy et al., 2012).
Empirical studies consider these three to constitute an “ecosystem” (Ambwani et al., 2014). Emotion regulation and interpersonal functioning exhibit reciprocal effects on the maintenance of ED.
Advantages of longitudinal network
- It considers symptoms cause each other over time.
- It allows us to identify some symptoms may play the most important roles across time points
- It allows sex-specific developmental patterns of eating disorders
The motivation is to obtain a holistic picture of the eating disorders ecosystem. However, the symptom-level dynamics of eating disorders have not been well investigated.
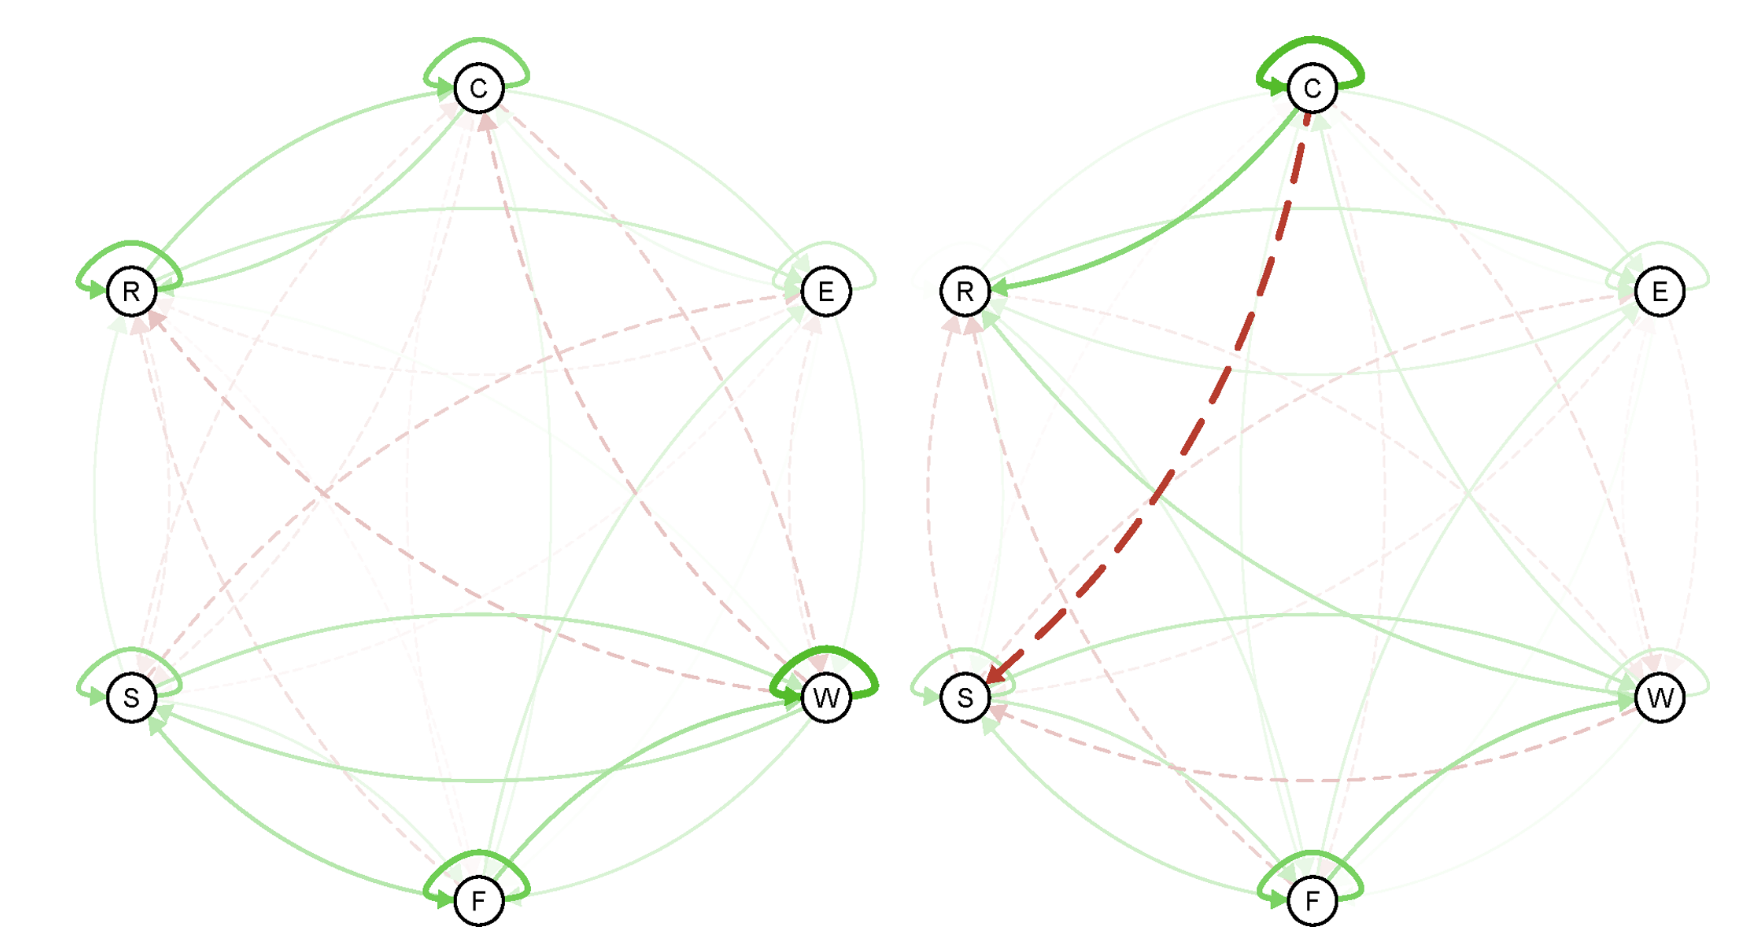
Results
Temporal Network Structure (left: boys; right: girls)
Emotion Disorder; Interpersonal Problems; Eating Regulation
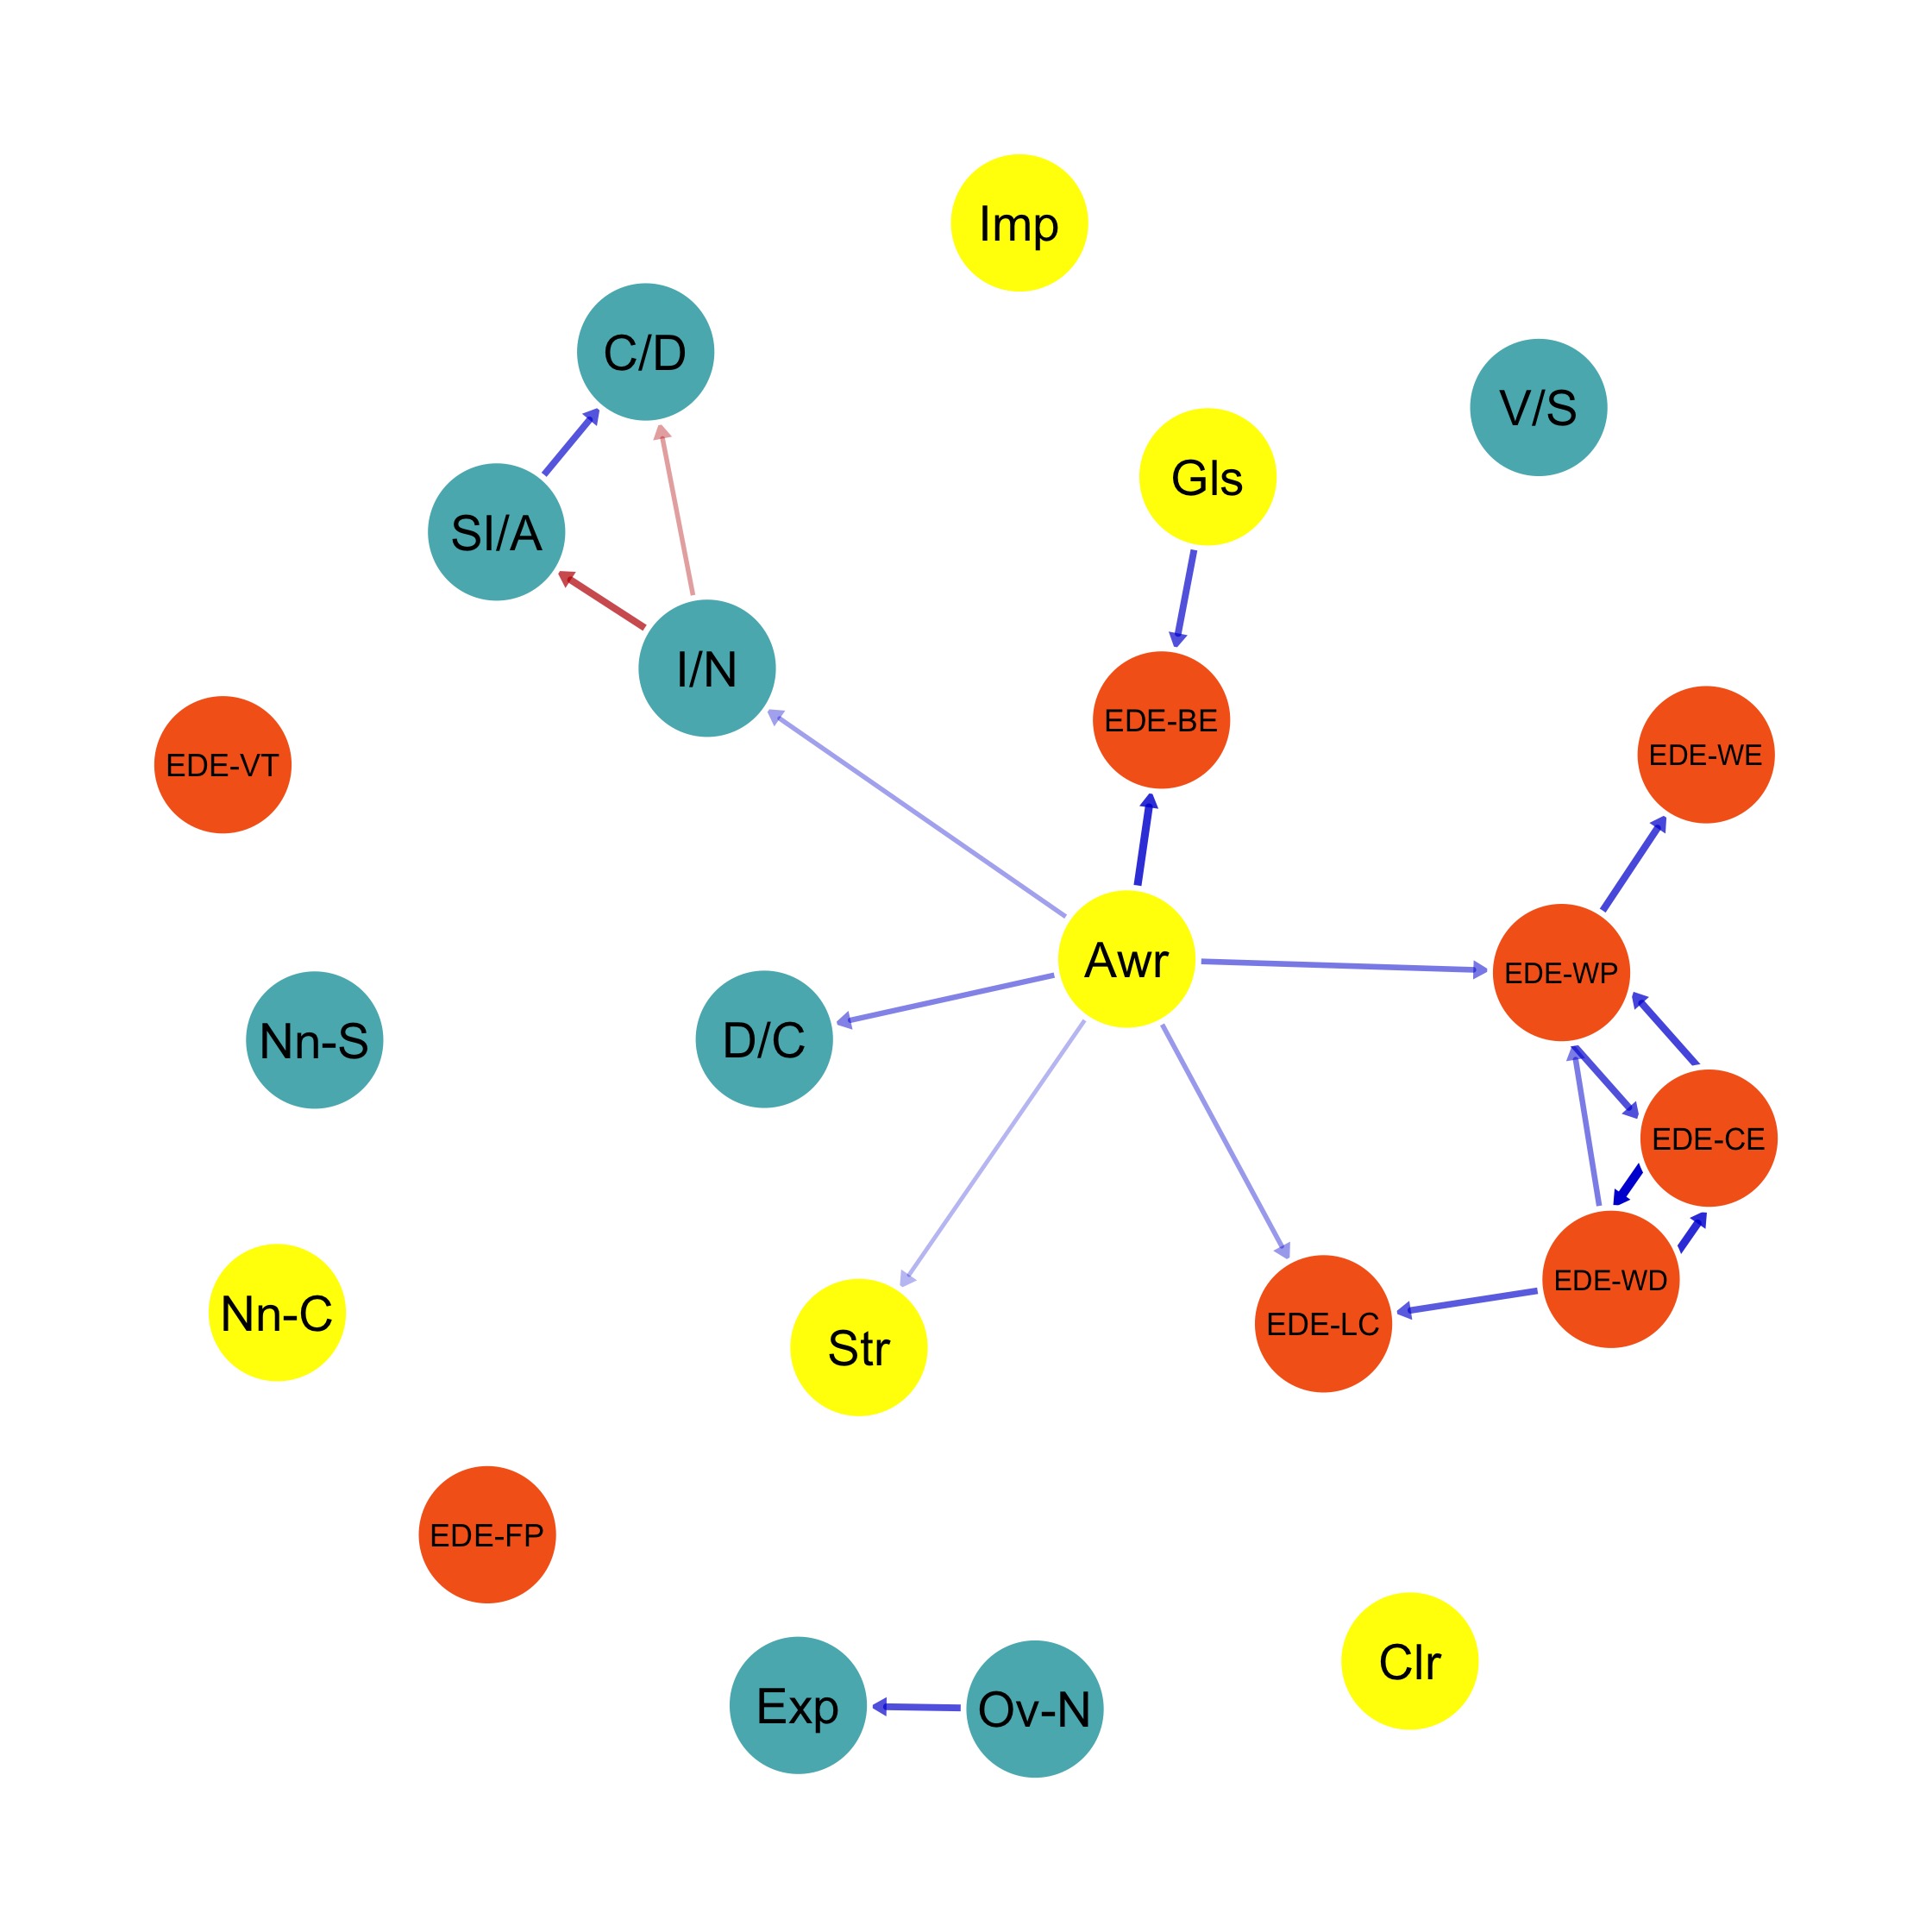
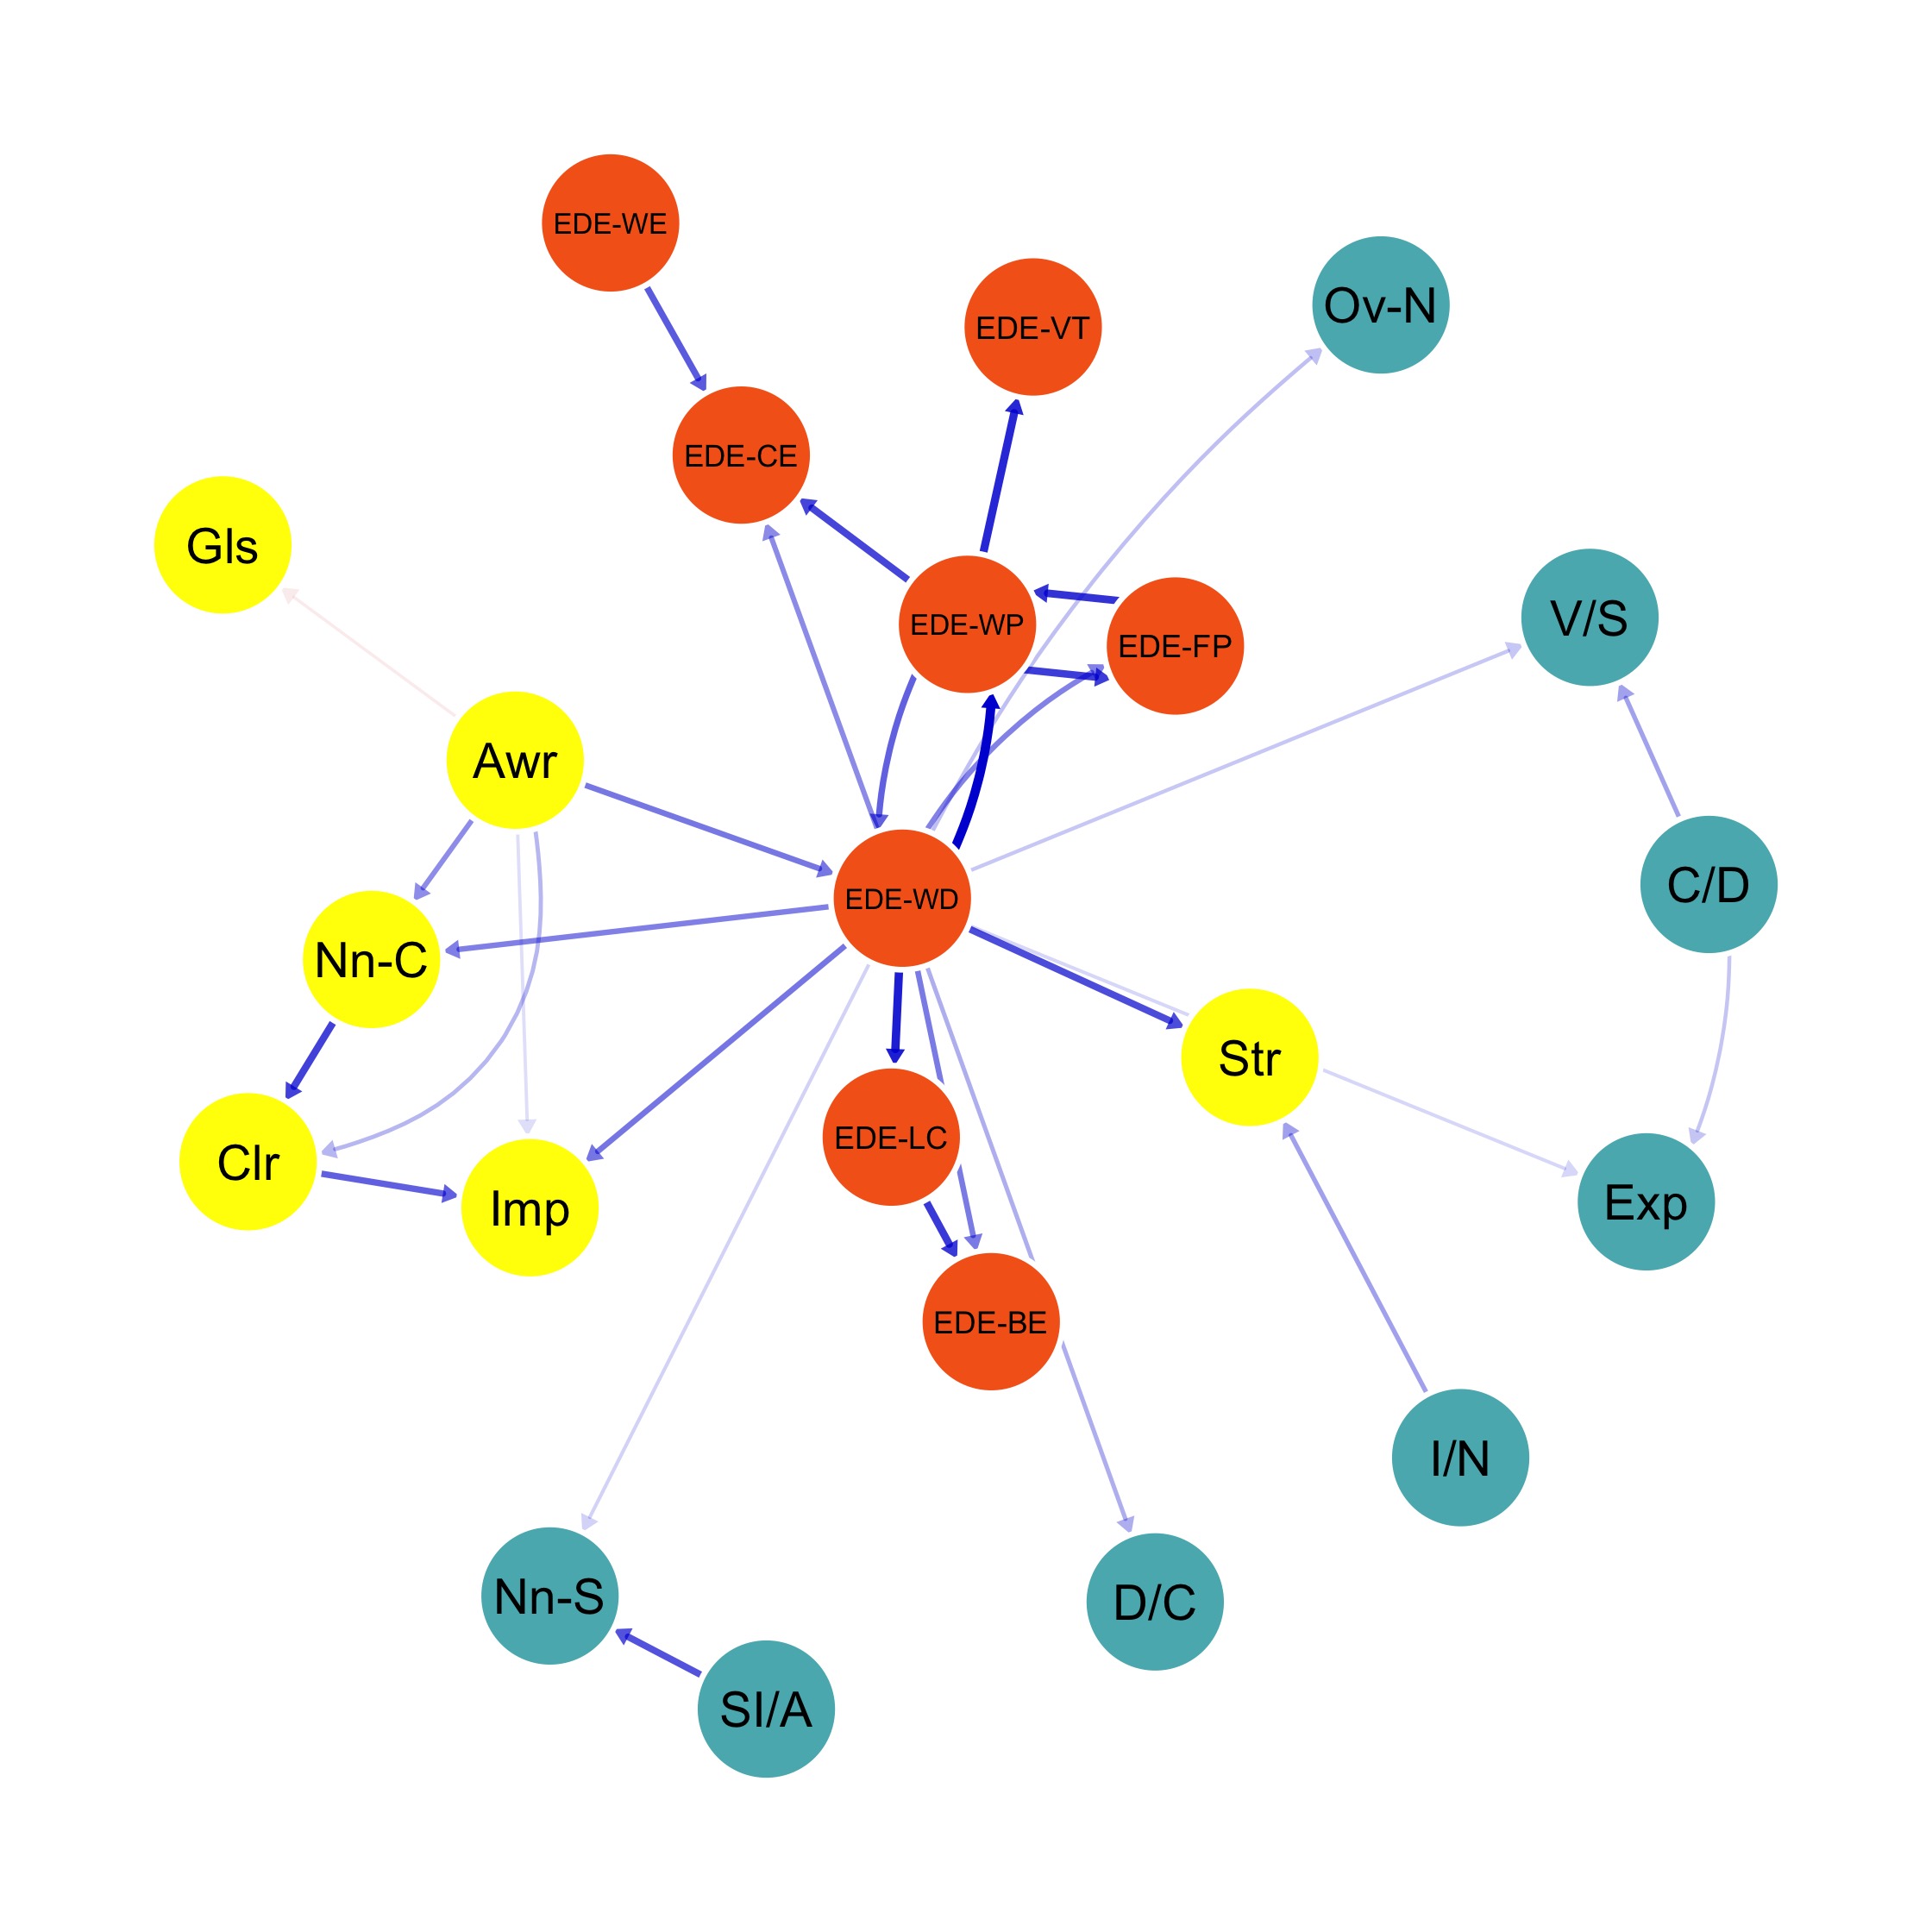
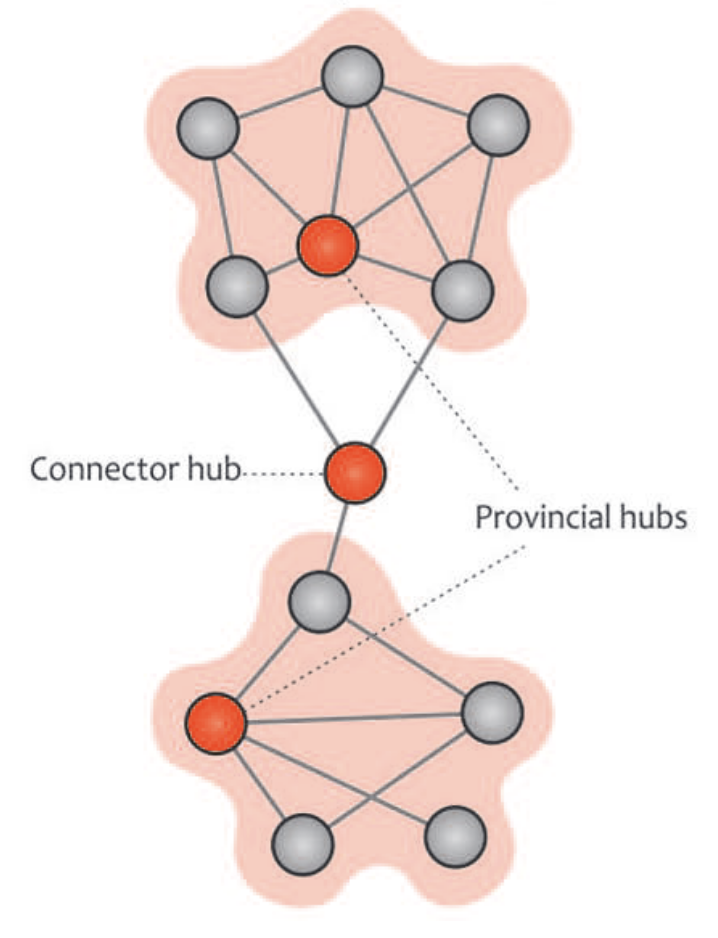
Network Hub (Important Symptoms) differences between sex groups
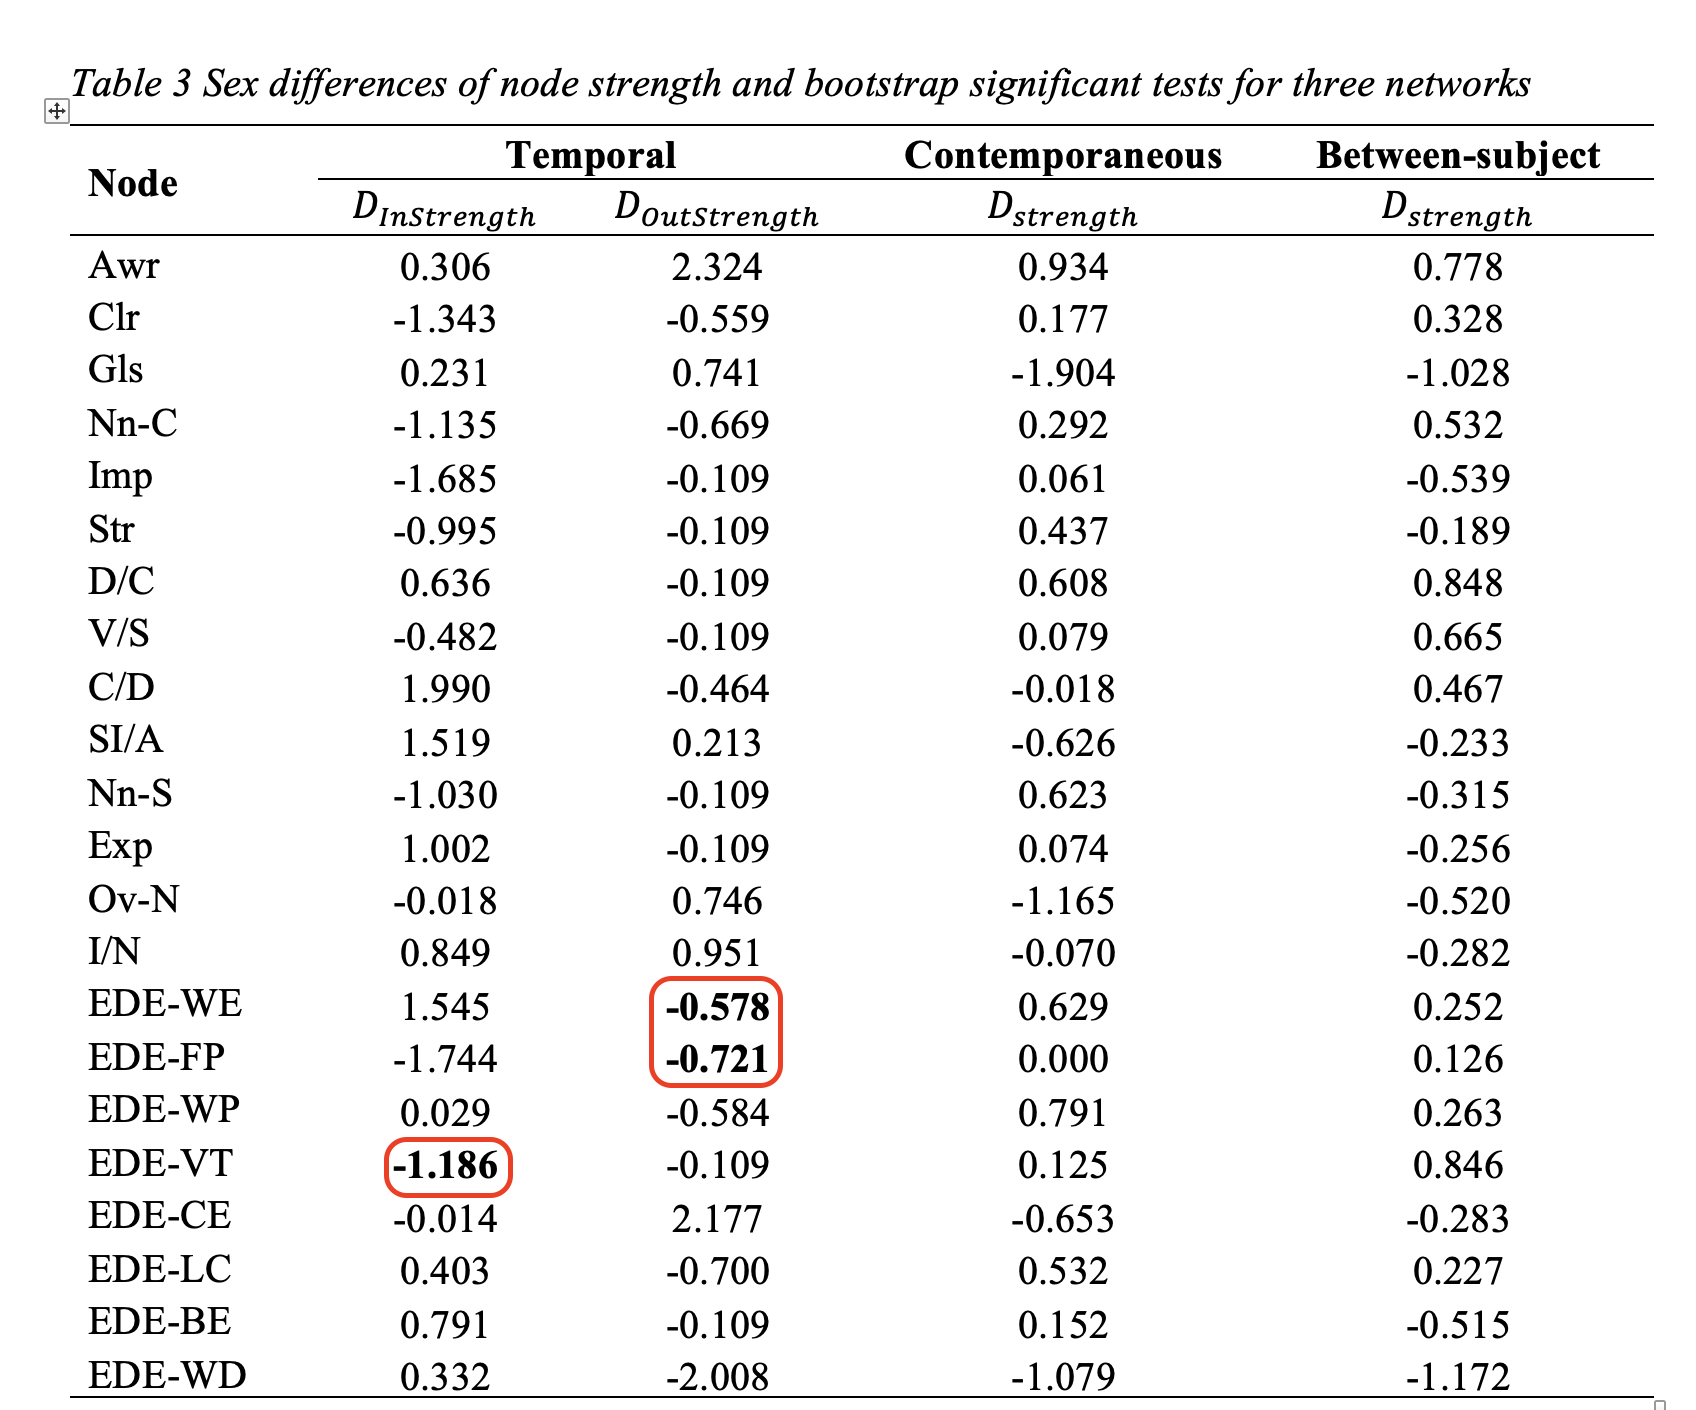
- Long periods without eating (EDE-WE) and Food preoccupation (EDE-FP) have significant sex differences in node out-strength.
- Weight/shape control by vomiting or taking laxatives (EDE-VT) has significant sex differences in node in-strength.
Network conncetor (Bridge Symptoms) differences between sex groups
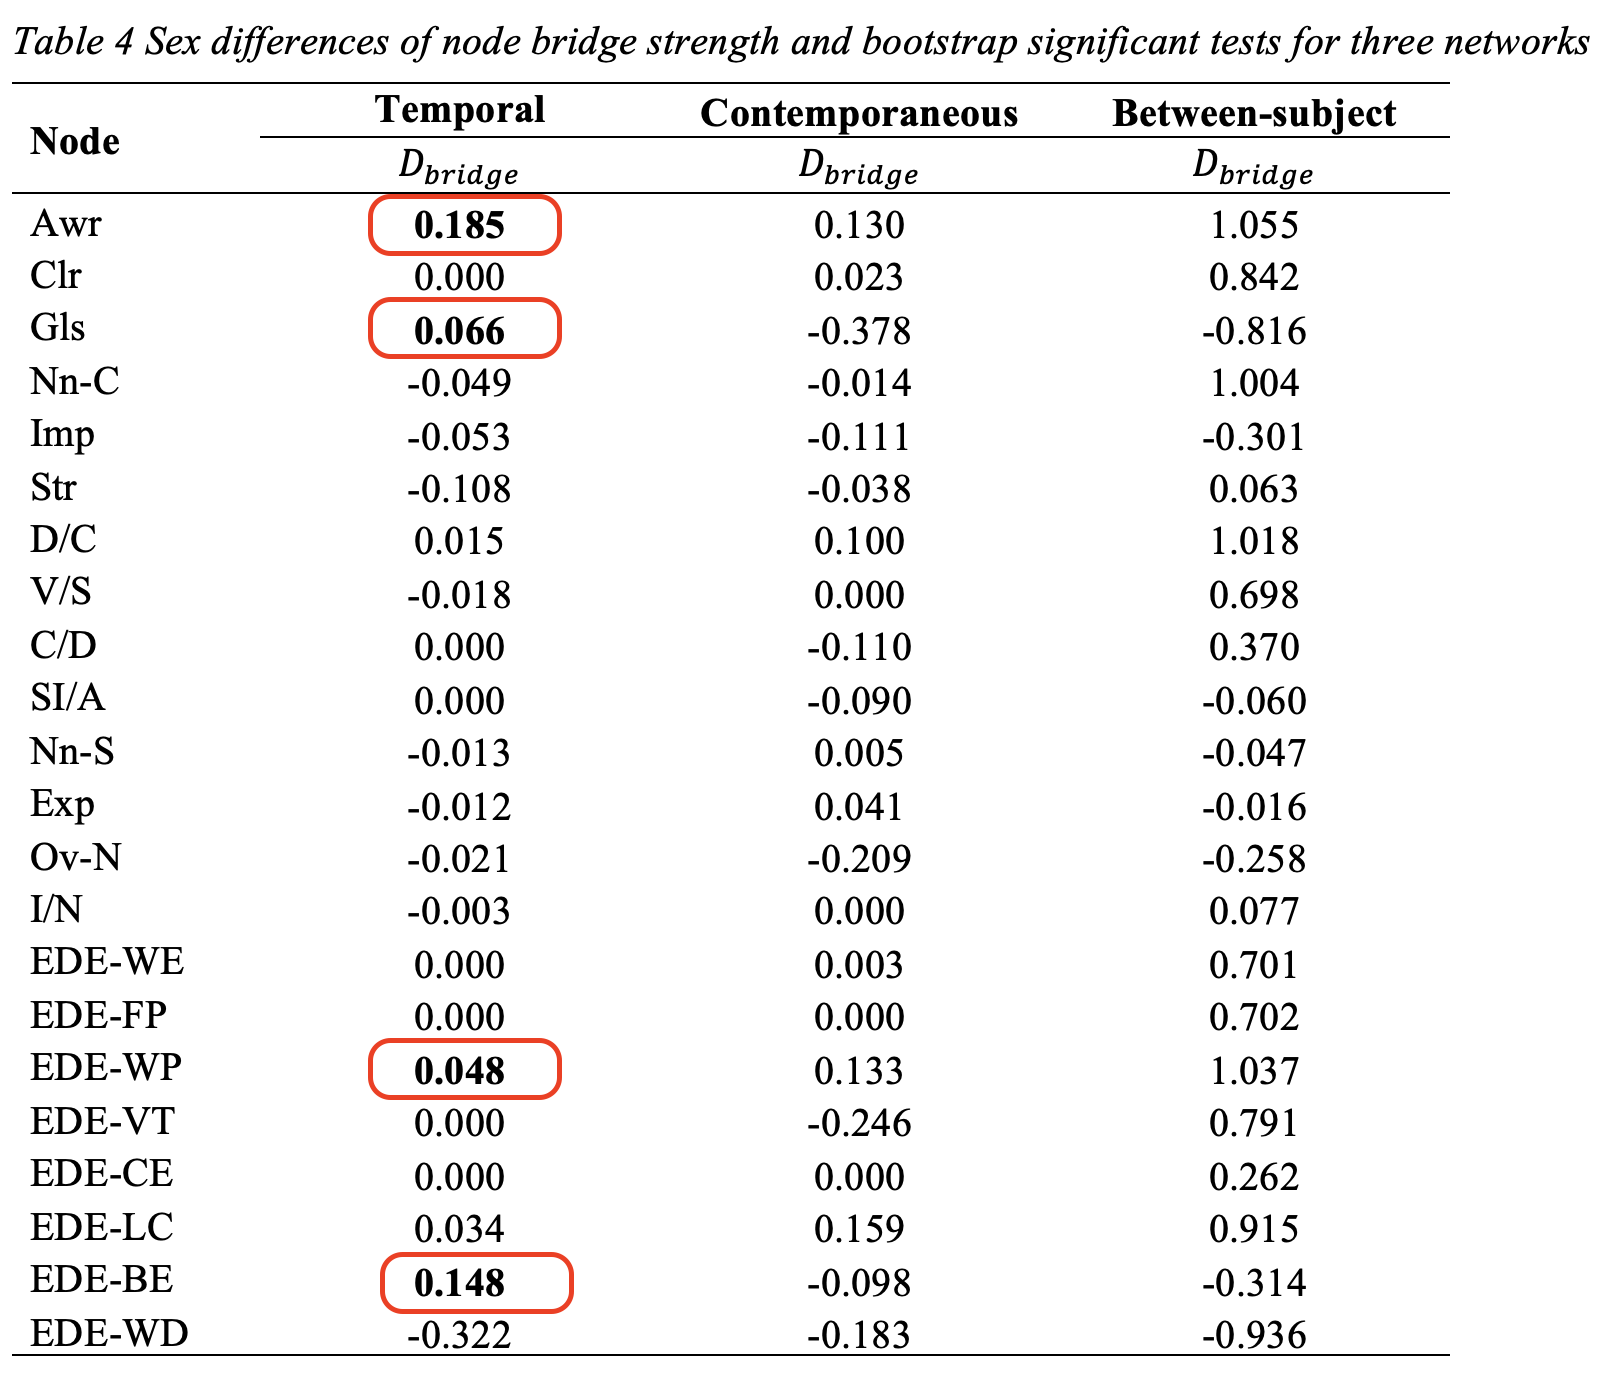
- Awareness (Awr) and Goals (Gls) have significant sex differences.
- Weight/shape preoccupation (EDE-WP) and Binge eating episode (EDE-BE) have significant sex differences.
Target nodes for intervention on comorbidity.
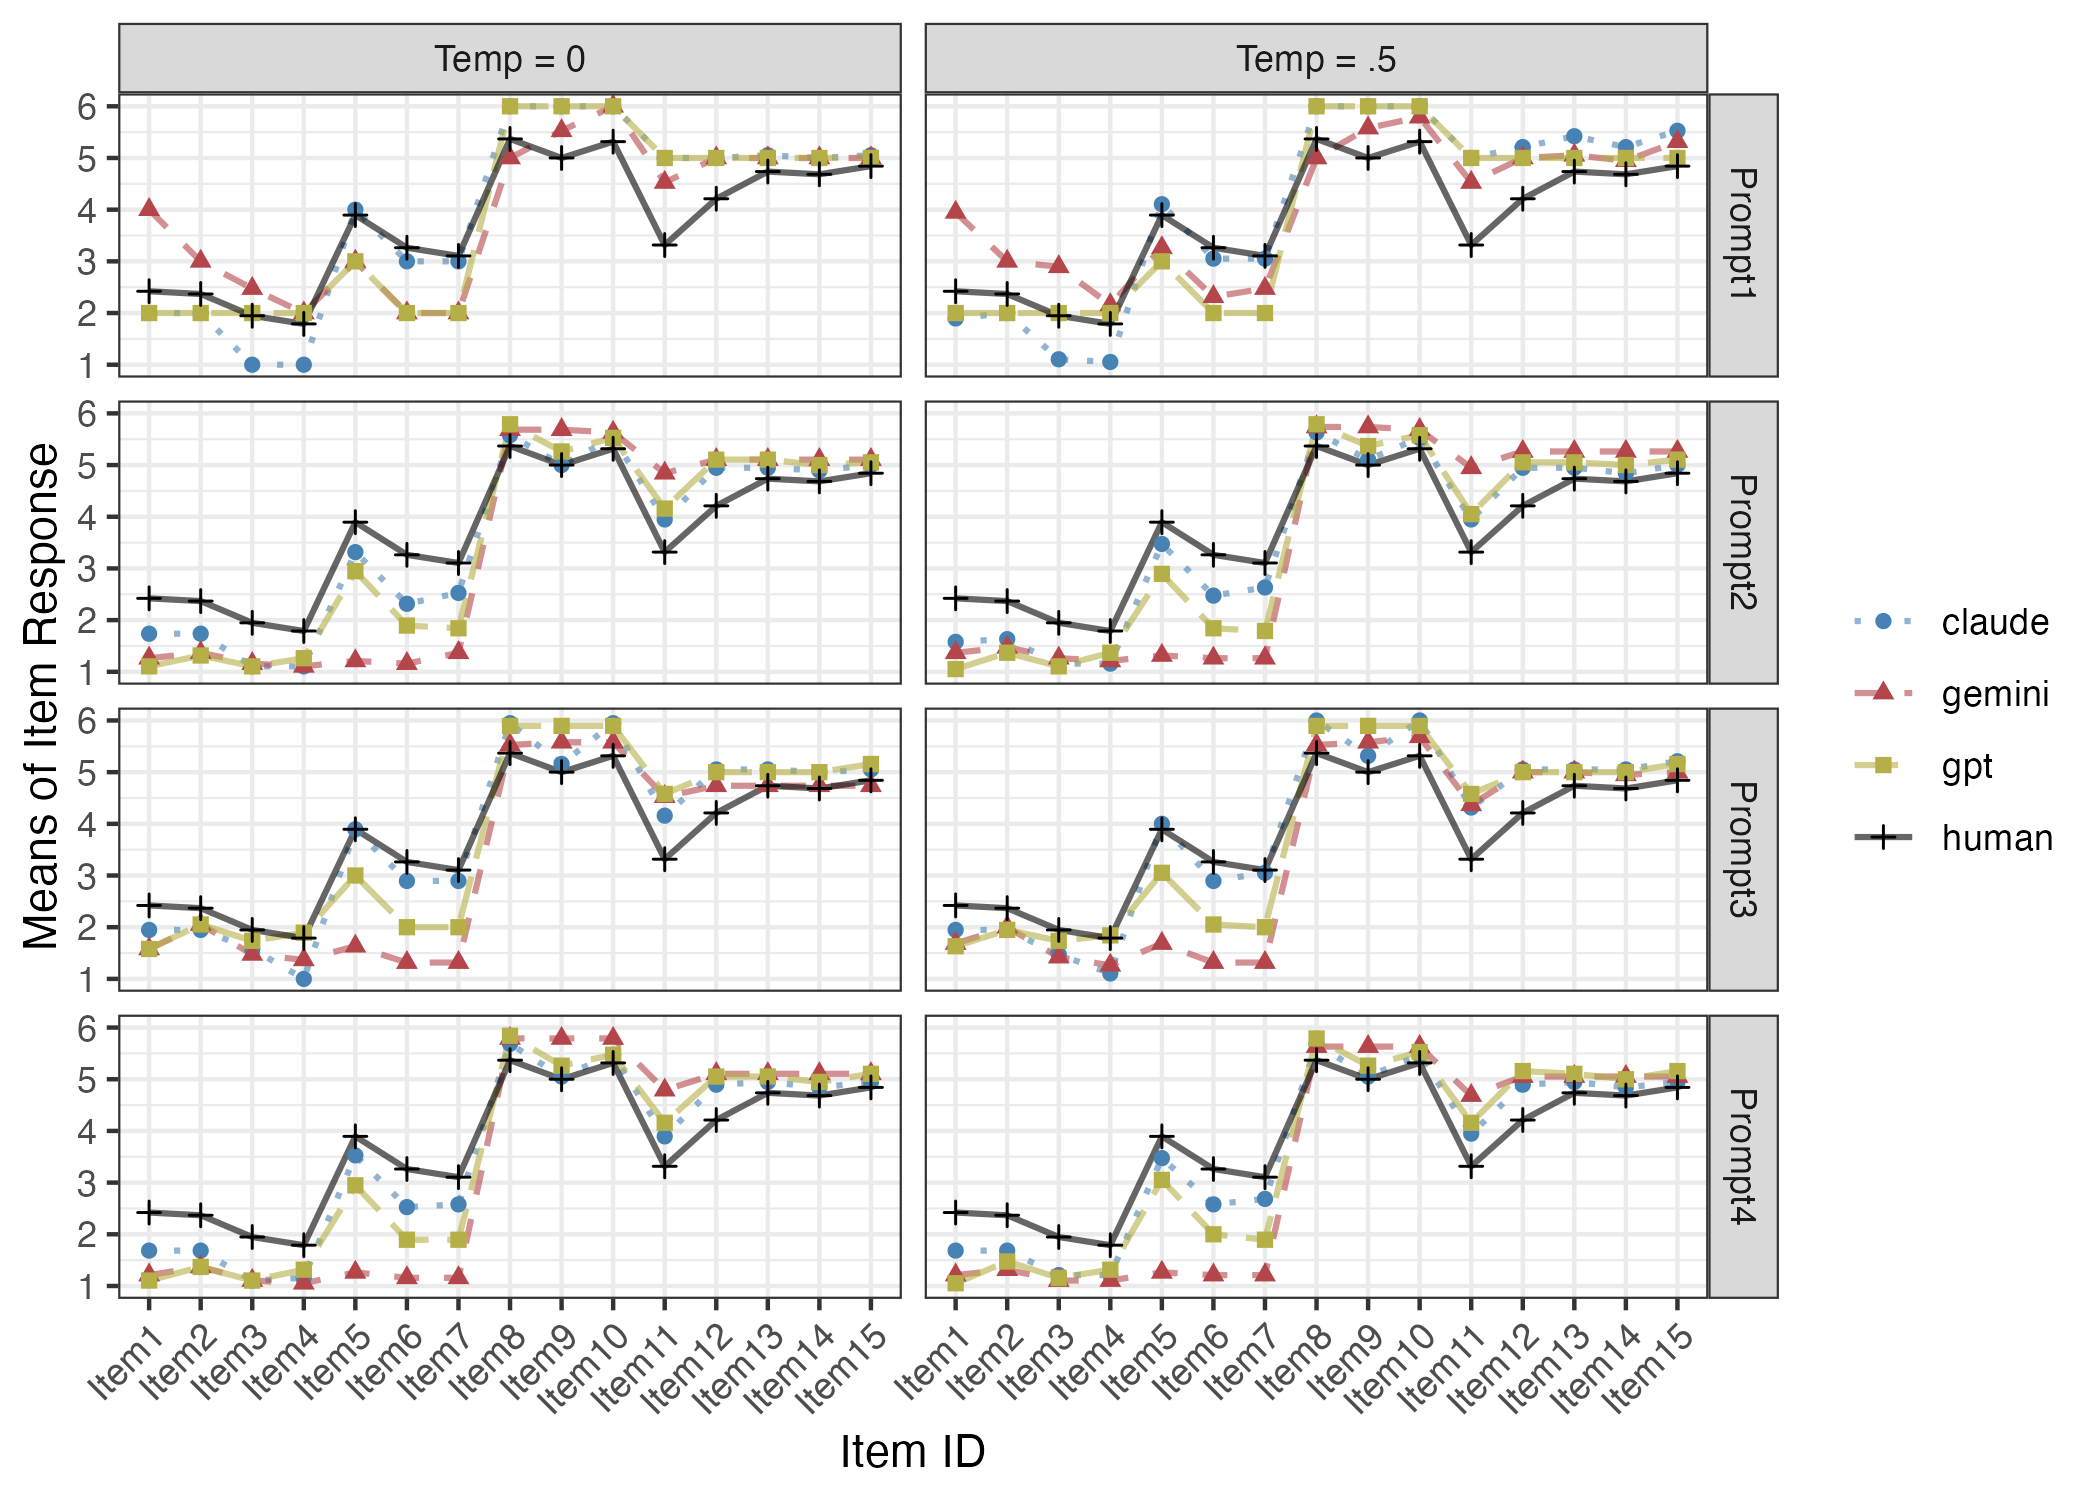
AI data augmentation for test development
One of my recent project let AI participants can serve as the data points in psychometric assessment given enough accurate human information.
Interview-informed large language models can align with real human responses regarding survey responses very well.