1 and 2 focus on the probabilistic relationships and further casual relationships among variables. 3 and 4 focuses on network structure and node importance. 5 focus on the regression coefficients of structural and measurement model.
All 5 analysis methods have a network-shaped diagram. Graphical modeling is a more “general” term that can comprise of the other network models.
Examples of Varied Networks
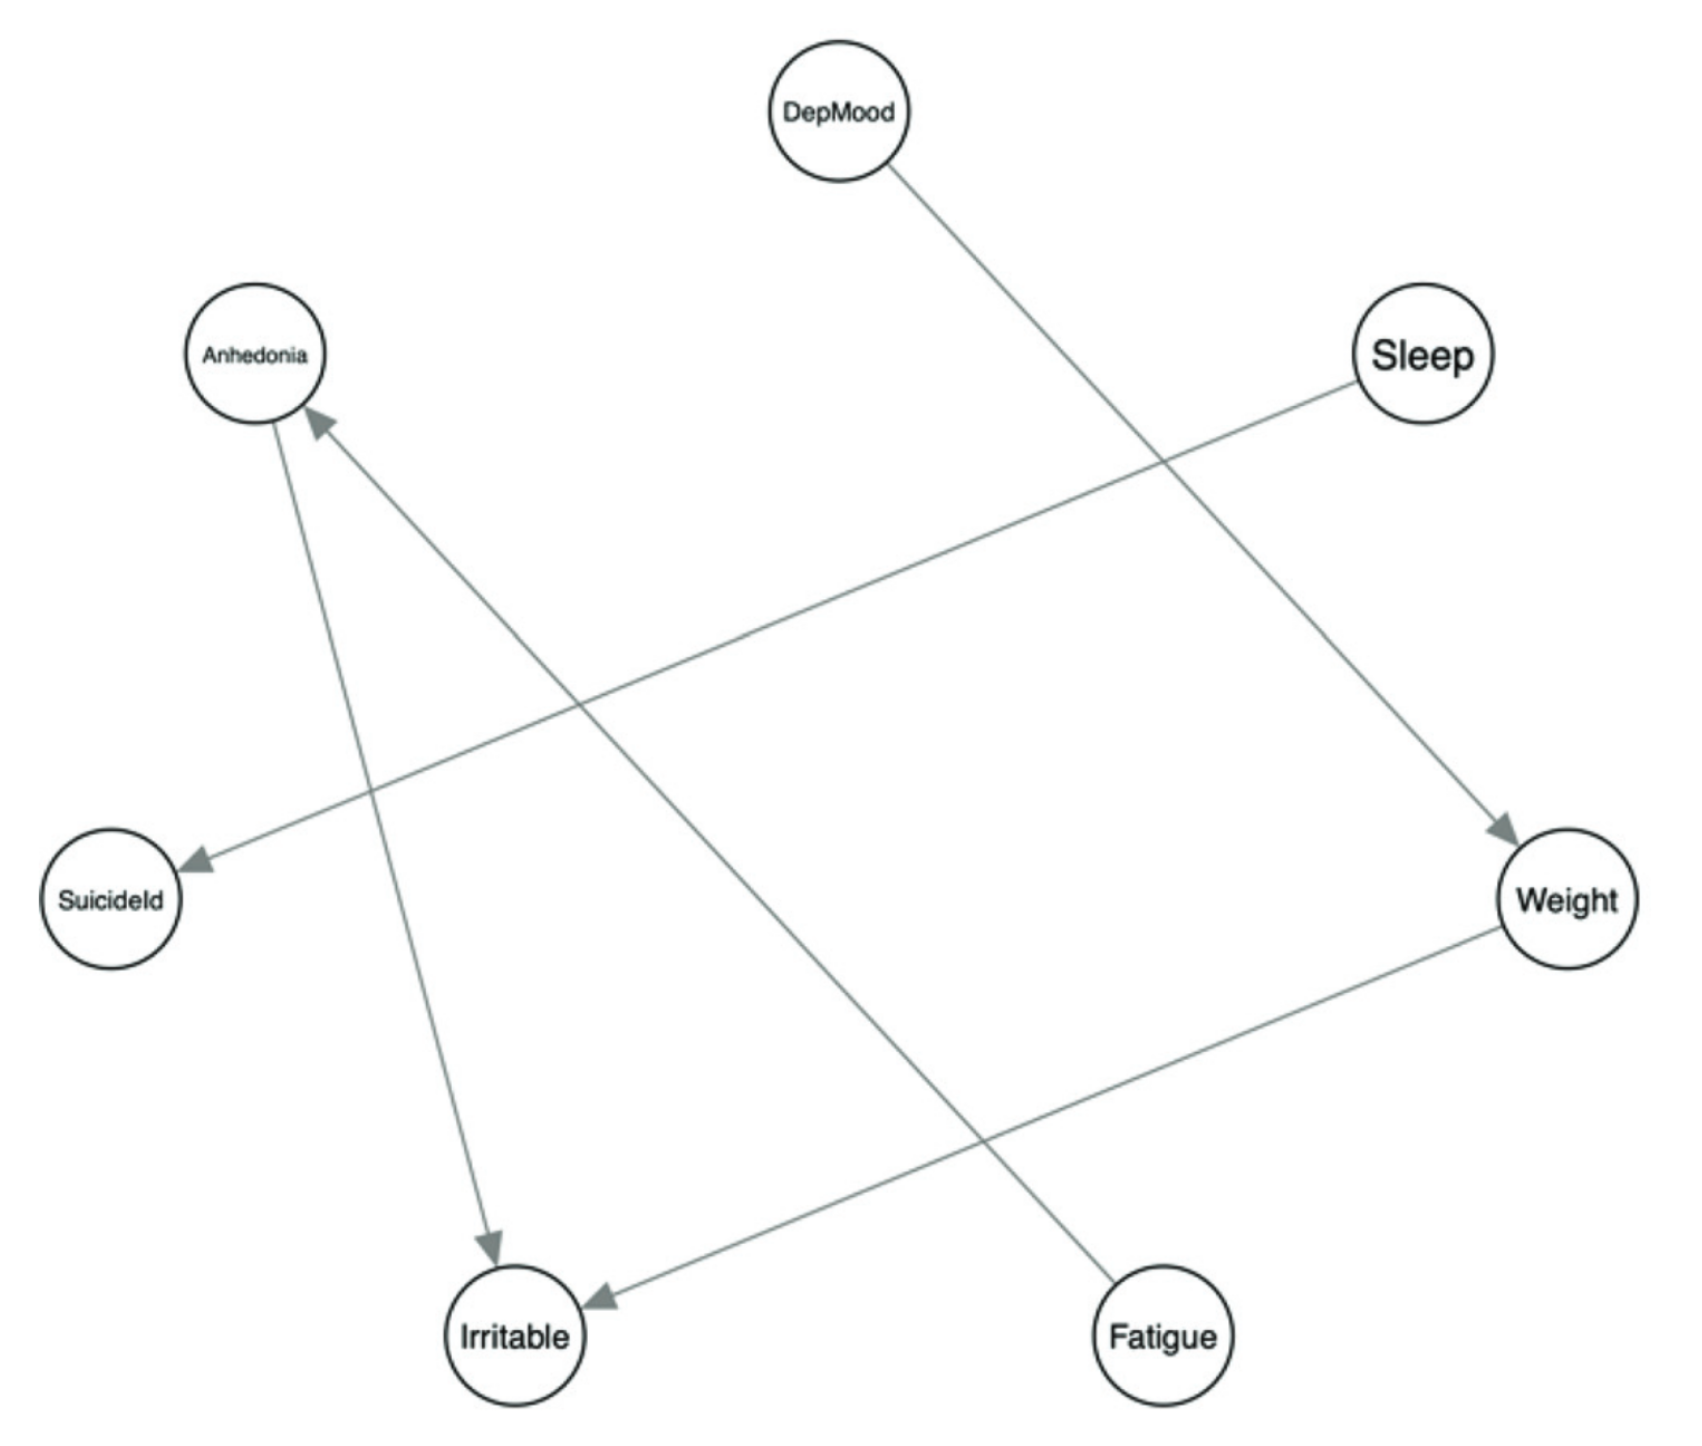
Figure 1: Bayesian Network (Briganti et al., 2023)
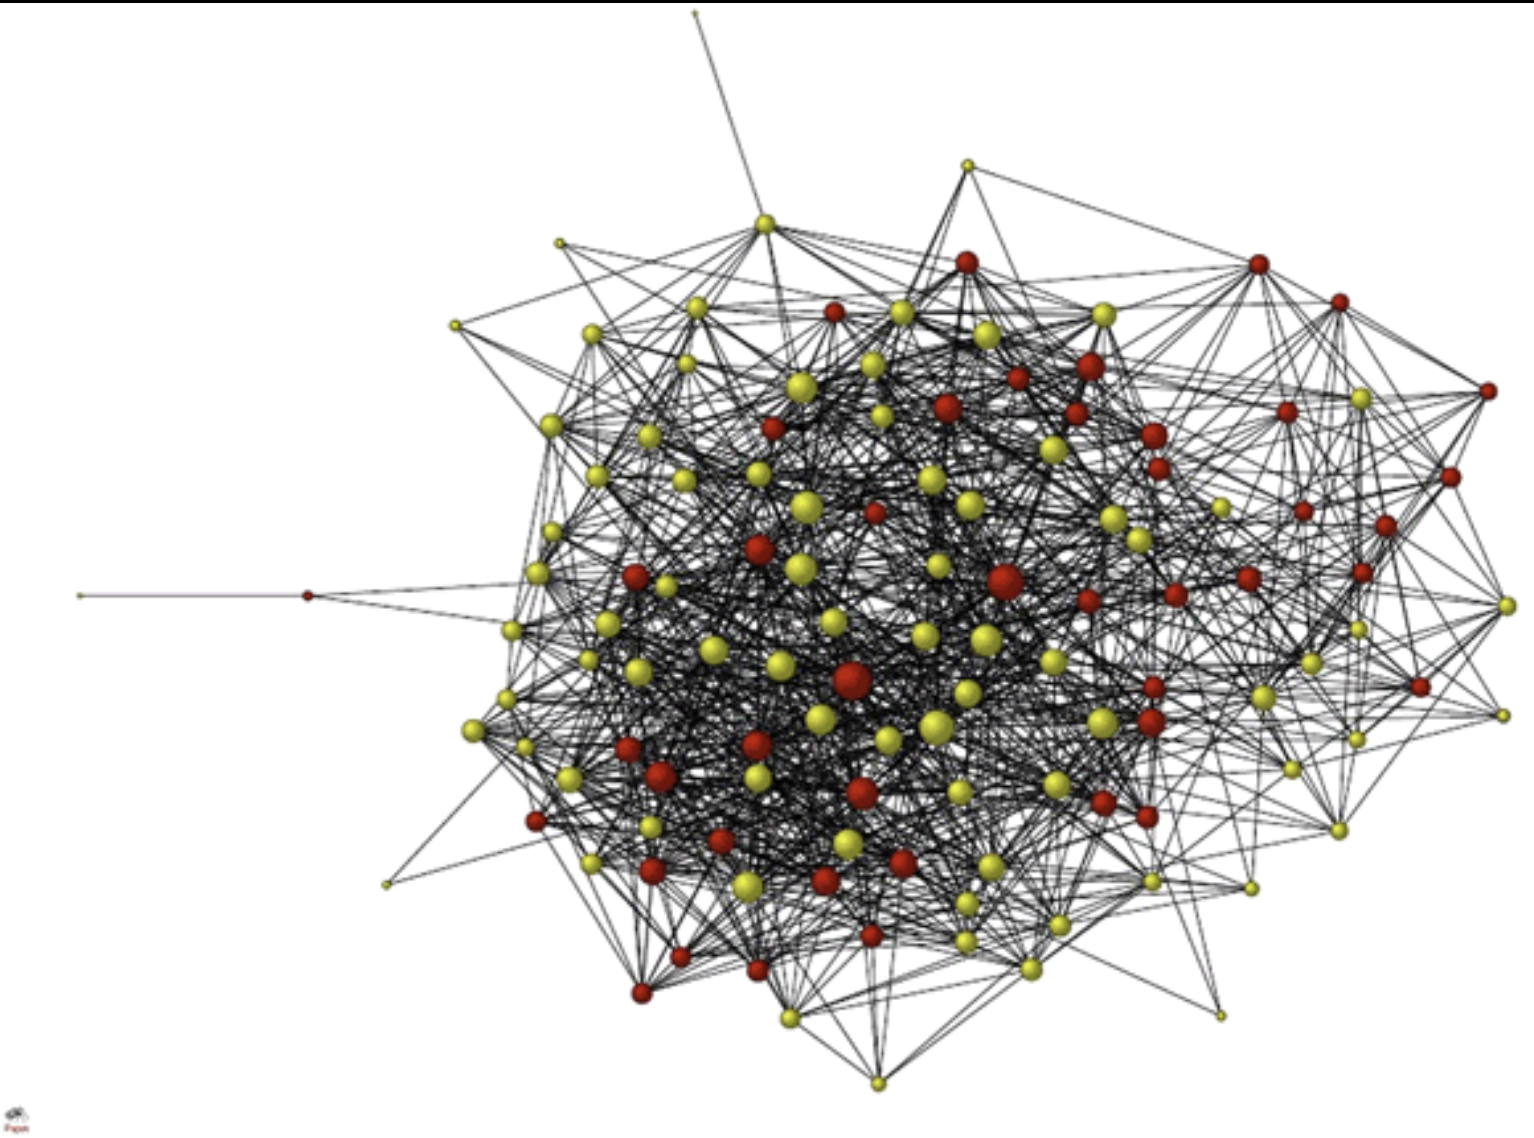
Figure 2: Facebook friendship network in a single undergraduate dorm (Lewis et al., 2008)
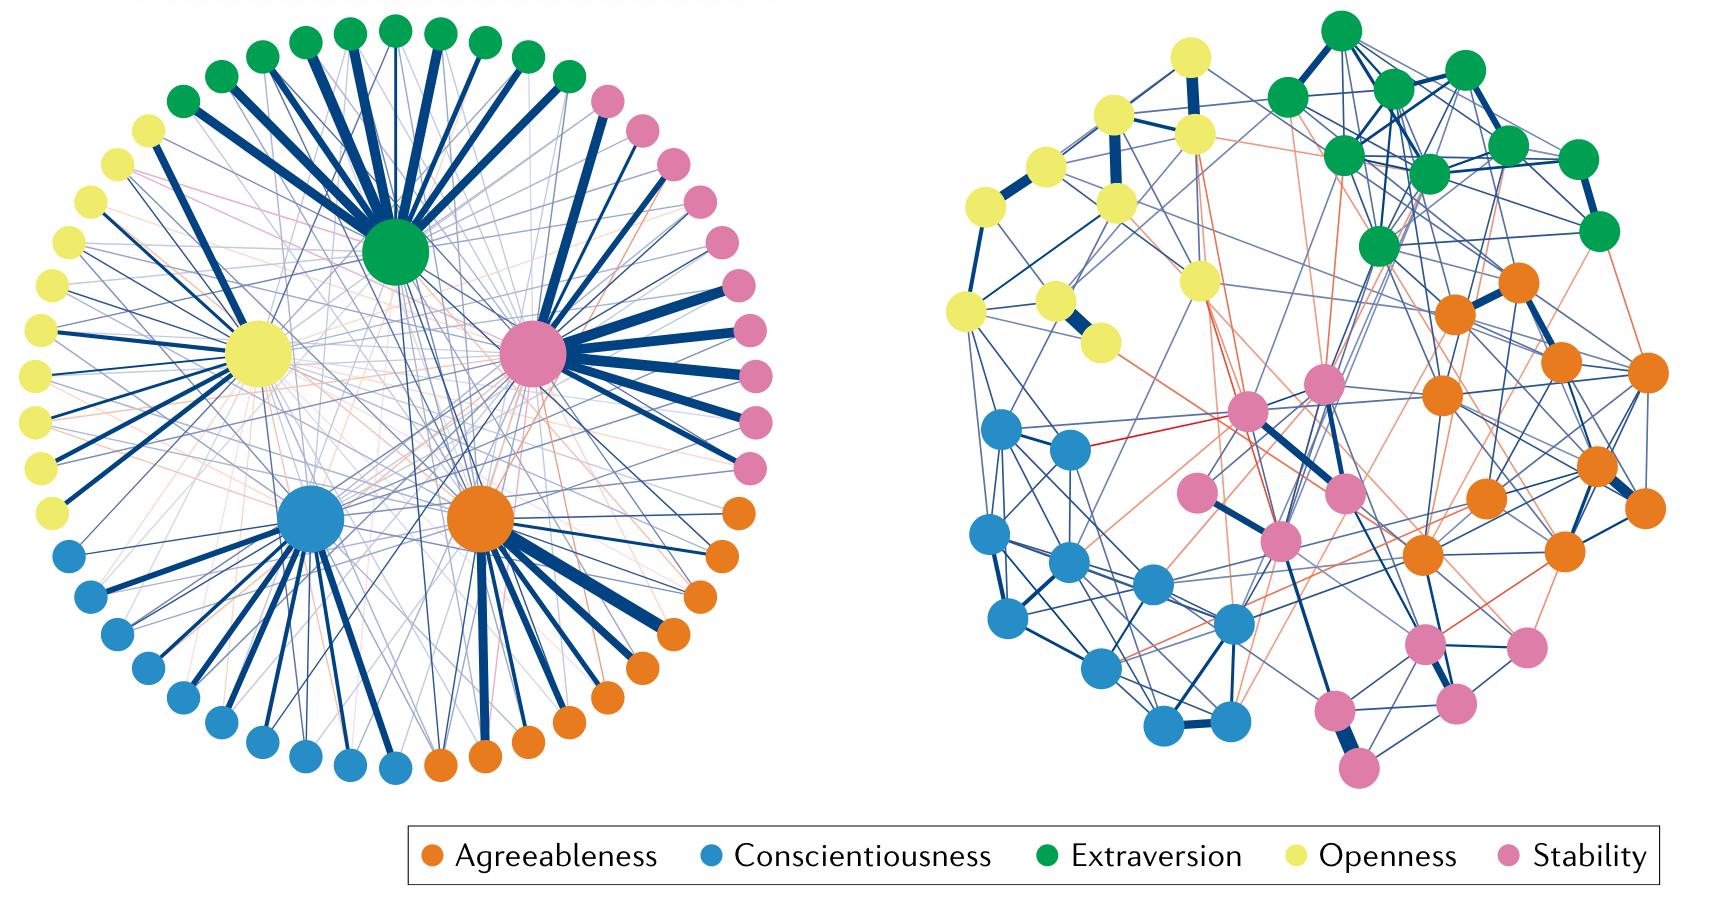
Figure 3: Factor Analysis and Psychological Network (Borsboom et al., 2021)
Research Aims
Bayesian Network (BN) aims to derive the casual relations between variables
Social Network aims to examine the network structure (community, density or centrality) of individuals
Factor Analysis aims to identify latent variables
Psychological Network aims to examines the associations among observed variables (topological structures) and their positions in the network.
Network Psychometrics
Network psychometrics is a novel area that allows representing complex phenomena of measured constructs in terms of a set of elements that interact with each other.
It is inspired by the so-called mutualism model and research in ecosystem modeling (Kan et al. 2019).
A mutualism model proposes that basic cognitive abilities directly and positively interact during development.
Psychometric network arises as dynamics or reciprocal causation among variables are getting more attentions.
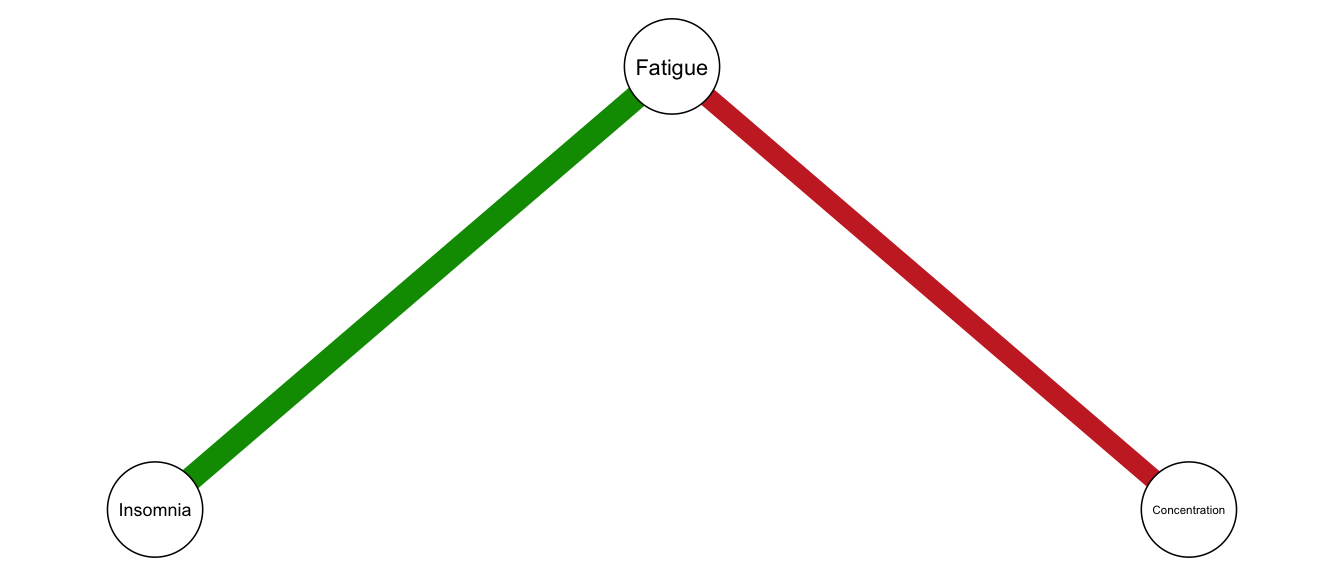
For example, individual differences in depression could arise from, and could be maintained by, vicious cycles of mutual relationships among symptoms.
A depression symptom such as insomnia can cause another symptom, such as fatigue, which in turn can determine concentration problems and worrying, which can result in more insomnia and so on.
Comparison to factor analysis
Factor analysis (common factor model) assumes the associations between observed features can be explained by one or more common factors.
For example, higher “depression” level leads to increased frequency of depressive behaviors
Psychometric network, however, assumes the associations between observed features ARE the reason of the development of depression. Or “depression” is the network itself.
unavoidable cycle of “fatigue -> worrying -> insomnia -> fatigue” will leads to higher “depression”
Utility of Psychometric Network
Explain the pathways of certain psychological phenomenon
Identify the most important problem that needed to be intervene in the treatment procedure
Examine group differences in interactions among observed features
Examine density of network: more dense network indicates more dynamic of certain problems
Examine clusters/communities of observed features: some symptoms are more likely to concur than other symptoms
Terminology I - Overall procedure
Network structure estimation: the application of statistical models to assess the structure of pairwise (conditional) associations in multivariate data.
Network description: characterization of the global topology and the position of individual nodes in that topology.
Psychometric network analysis: the analysis of multivariate psychometric data using network structure estimation and network description.
Terminology II - Network description
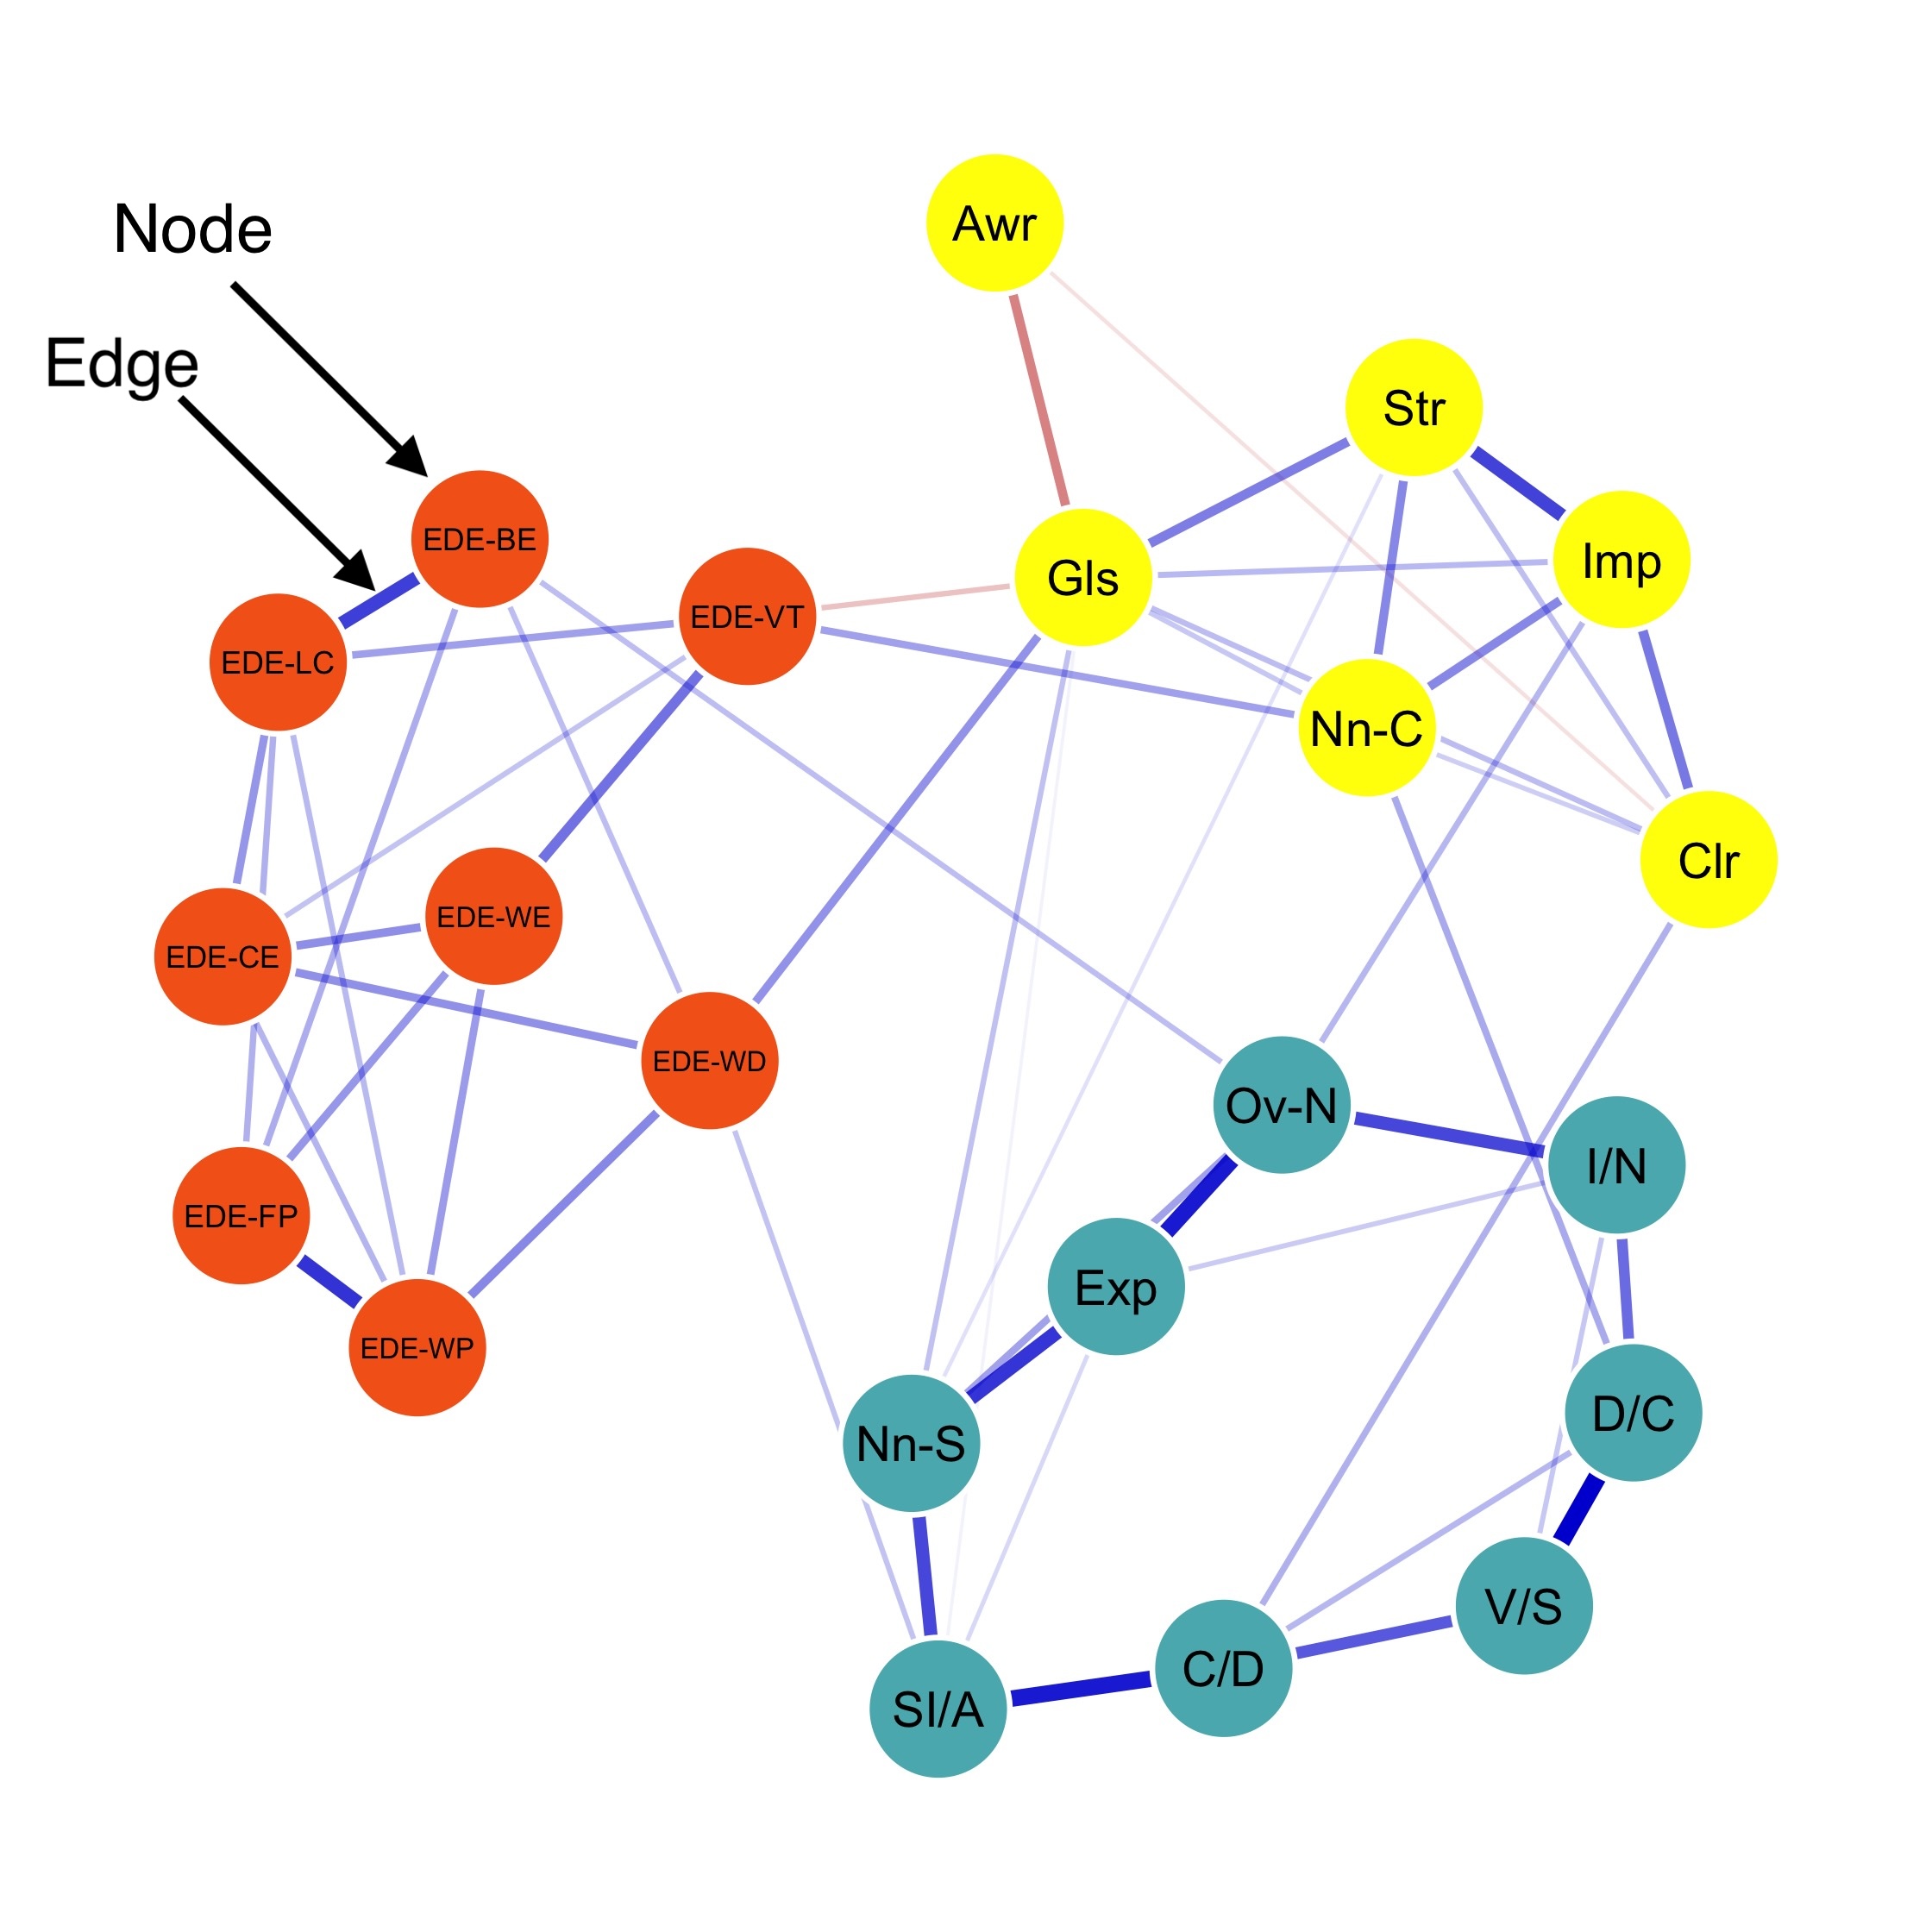
Node: psychometric variables that are selected in the network
such as responses to questionnaire items, symptom ratings, and cognitive test scores, background variables such as age and gender, experimental interventions.
Edge (conditional association): associations between variables taking into account other variables that may explain the association
Edge weight: parameter estimates that represent the strength of conditional association between nodes
Node centrality: the relative importance of a node in the context of other nodes, that can be calculated using different statistics
Terminology III - Network structure estimation
Node selection: the choice of which variables will function as nodes in the network model.
Network stability analysis: the assessment of estimation precision and robustness to sampling error of psychometric networks.
Pairwise Markov random field (PMRF): an undirected network that represents variables as nodes and conditional associations as edges, in which unconnected nodes are conditionally independent.
Exploratory Nature
Psychometric network is exploratory by nature. To obtain a meaningful network structure, psychometric networks need to drop weak edges but keep strong edges.
This procedure is typically called edge selection. One popular edge selection method is regularization.
Original network structure without regularization is called saturated network; vice versa regularized network
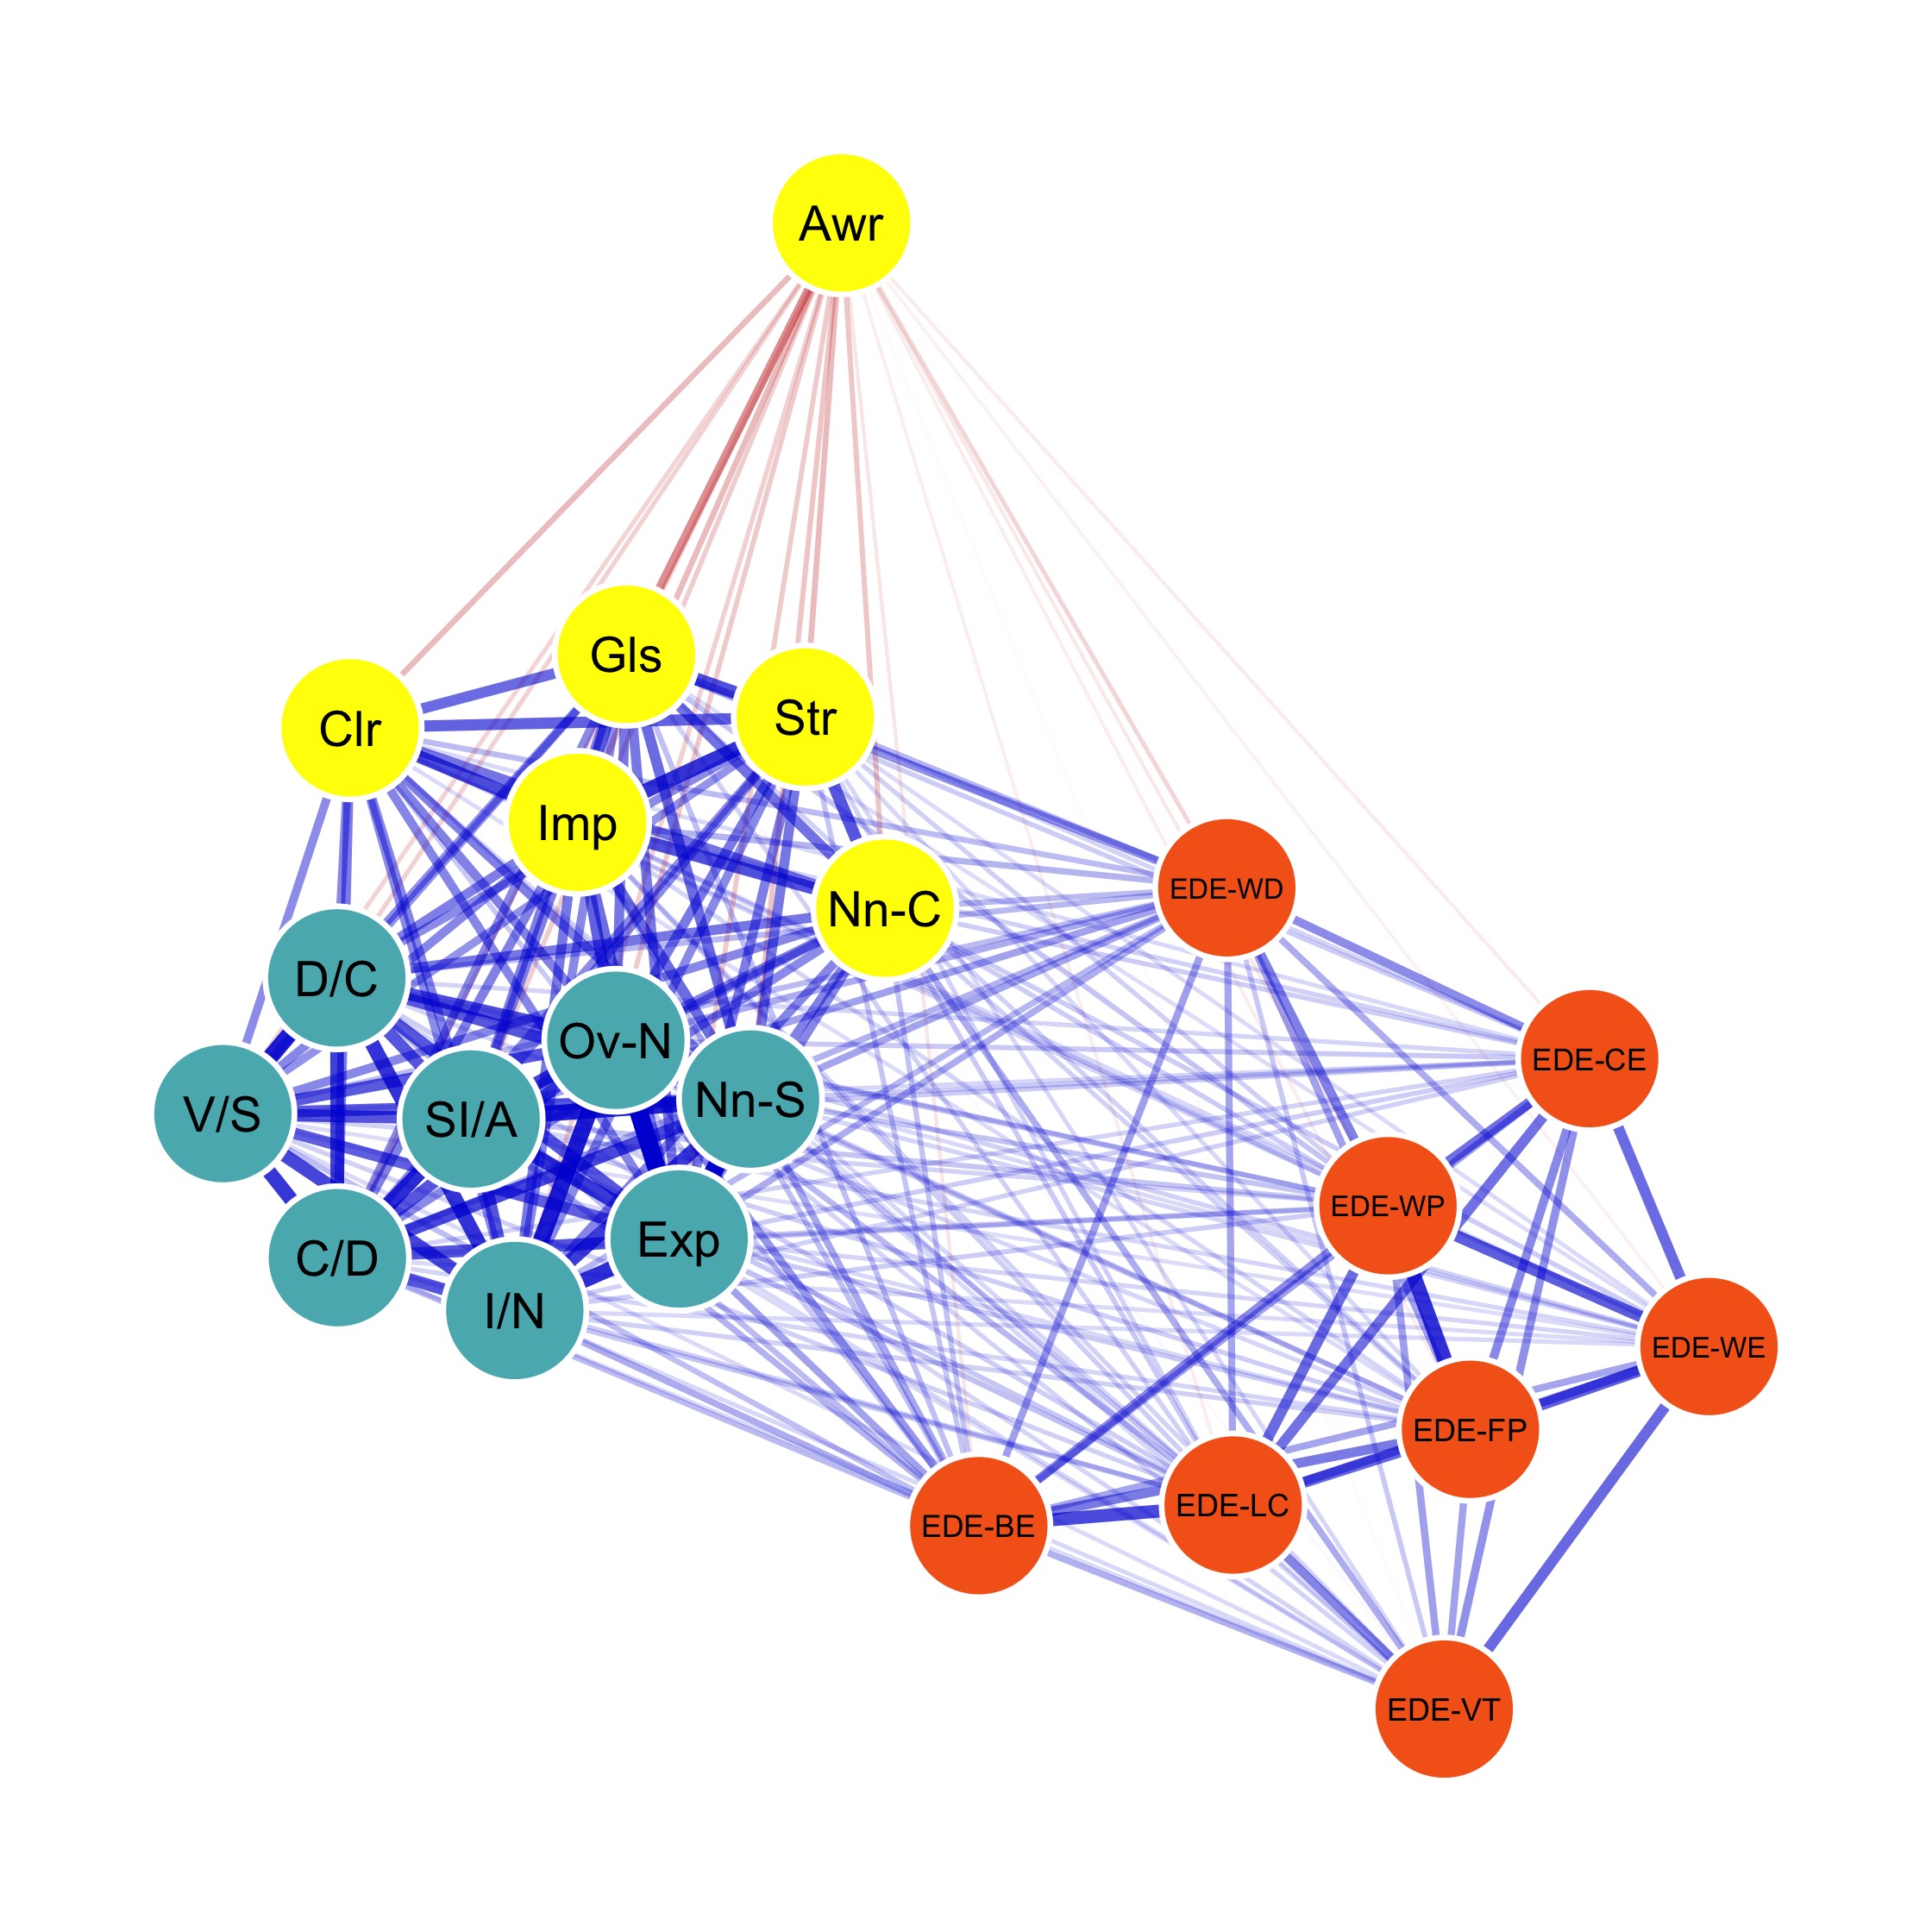
Emotion regulation (Awareness), Interpersonal problems and eating disorder
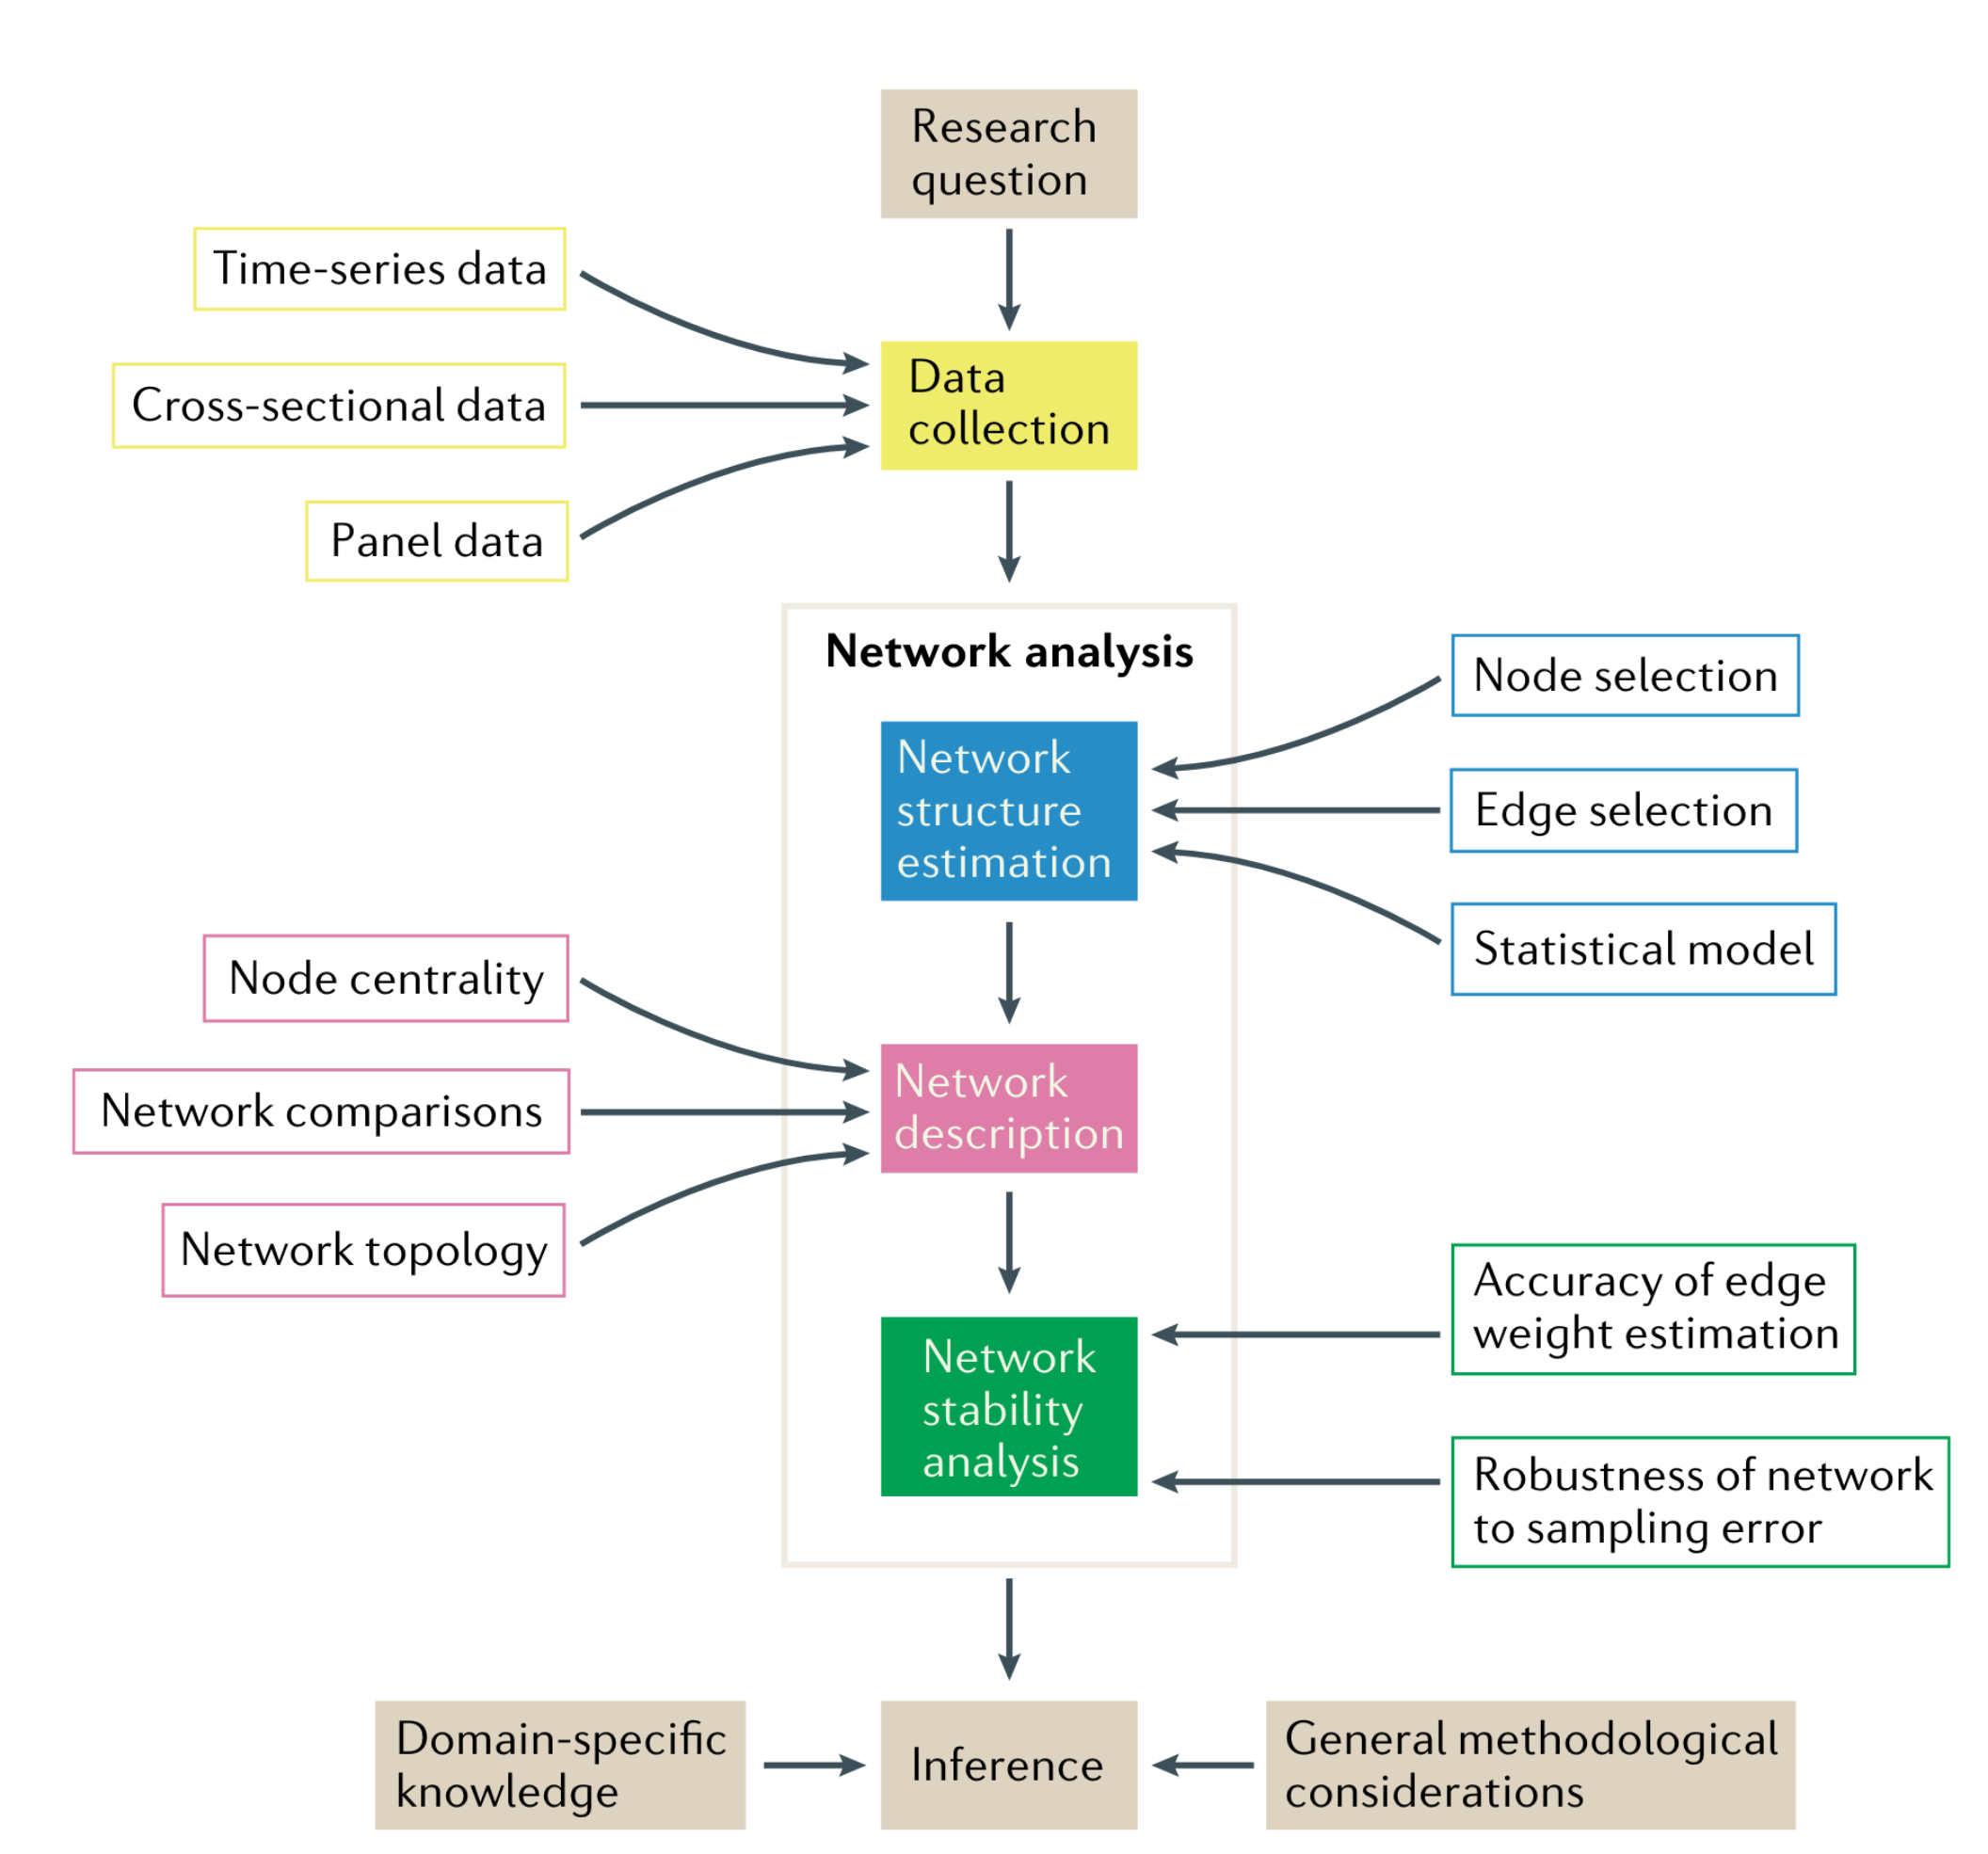
Workflow of psychometric network
Psychometric network analysis methodology includes steps of network structure estimation (to construct the network), network description (to characterize the network) and network stability analysis (to assess the robustness of results).
Types of data and network models
Cross-sectional data (N = large, T = 1)
Ising model for categorical variables
Gaussian graphical model (GGM; Foygel & Drton, 2010) for continuous variables
Mixed graphical model (MGM) for mixed types of variables: include both categorical variables and continuous variables
Panel data (N >> T)
Multilevel Graphical vector autoregressive model (GVAR)
i.e., longitudinal data, repeated measures
Time-series data (\(N \geq 1\), T = large)
Graphical vector autoregression
i.e., ecological momentary assessment, conducted via smartphones
Network Estimation
Gaussian graphical model
GGM is one type of Pairwise Markov random field (PMRF) when data are continuous.
In a PMRF, the joint likelihood of multivariate data is modeled through the use of pairwise conditional associations, leading to a network representation that is undirected.
For \(p\)-dimensional data following multivariate normal distribution:
Where \(K\) is a inverse covariance matrix of \(\boldsymbol{X}\) (\(K = \Sigma^{-1}\)), also known as precision/concentration matrix.
To obtain sparse network structure, the \(i\)th row and \(j\)th column element of \(\boldsymbol{K}\), \(k_{ij}=0\) when edge \(\{j, k\}\) is not included in the network \(G\),
It means \(X^{(i)}\) and \(X^{(j)}\) are independent conditional on the other variables .
Partial correlation networks
GGM can be standardized as the partial correlation network, in which each edge of GGM representing partial correlations between two nodes.
ggm() function in the package further separates the precision matrix \(R\) into two parts: \(\Delta\) and \(\Omega\). \(\Omega\) matrix will the estimated network edges in GGM.
Partial correlation matrix can be estimated using Bayesian approach. The BGGM package uses Bayesian Hypothesis Testing to estimate the partial correlation matrix.
The advantage of Bayesian approach is that it can provide the posterior distribution of the partial correlation matrix, which can be used to assess the uncertainty of the estimates.
library(BGGM)set.seed(1234)dat <- mvtnorm::rmvnorm(500, mean =rep(0, 3), sigma = Sigma)fit_bggm <- BGGM::estimate(dat, type ="continuous", iter =1000, analytic =FALSE)fit_bggm$pcor_mat |>round(3)
Network stability: The assessment of estimation precision and robustness to sampling error of psychometric networks. Assess whether edge weights and node centrality changes with case dropping subset bootstrap.
Network sensitivity: The sensitivity analysis of the network by adding covariates (age, gender, hukou, education, marital status, and self-rated health) to the model to control their confounding effects. Report whether some central nodes are no longer central after adding some variables.
Node-level metrics:
Total number of node
Node centrality: the position of individual nodes within the network. A generic term that subsumes a family of measures that aim to assess how central a node is in a network topology, such as node strength, betweenness and closeness.
Node bridge strength: the degree to which one node connects two nodes from different facets. The bridge nodes (nodes with high bridge strength) that connect different communities of nodes (e.g., Neurotic factors is bridge nodes between personality traits and depressive symptoms Li and Zhang (2024)).
Node centrality differences between groups: node A is central in group 1’s network but not so central in group 2’s network.
Edge-level metrics:
Total Number of edges: proportions of non-zero edges
Edge weight: edge weights typically are parameter estimates that represent the strength of the conditional association between nodes. Average edge weight can be used to assess the overall strength of network connections.
70.6% edges are nonzero using EBICglasso, while only 63.6% edges are nonzero using BF method and 62.0% edges are kept using \(\alpha =.01\) significance testing
BGGMfit <- BGGM::explore(bfi[,1:25], type ="continuous", iter =1000, analytic =FALSE) |>select()density_nonzero_edge(BGGMfit$pcor_mat_zero)
[1] 0.6666667
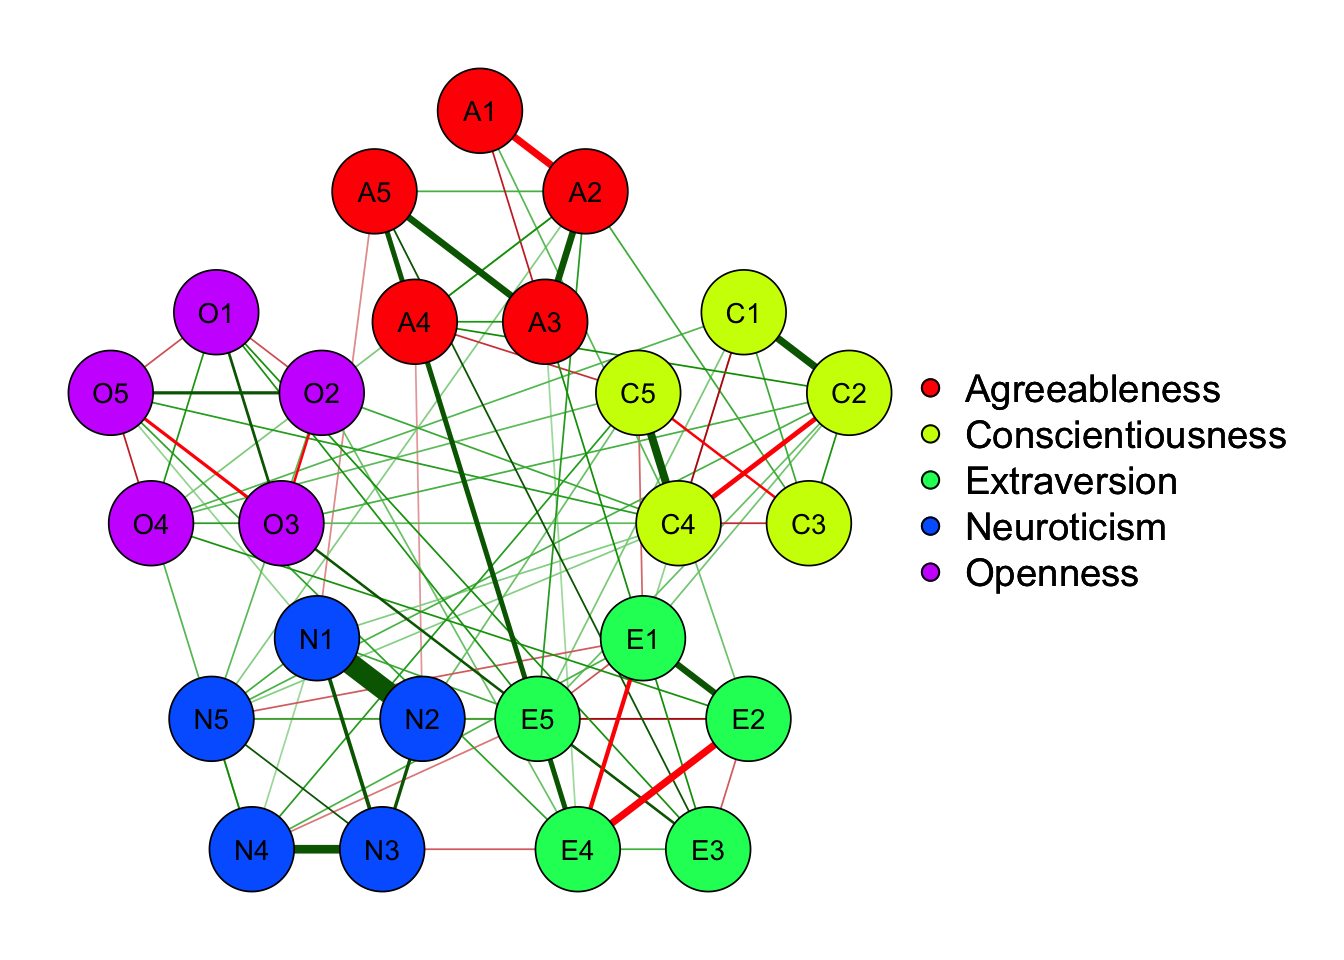
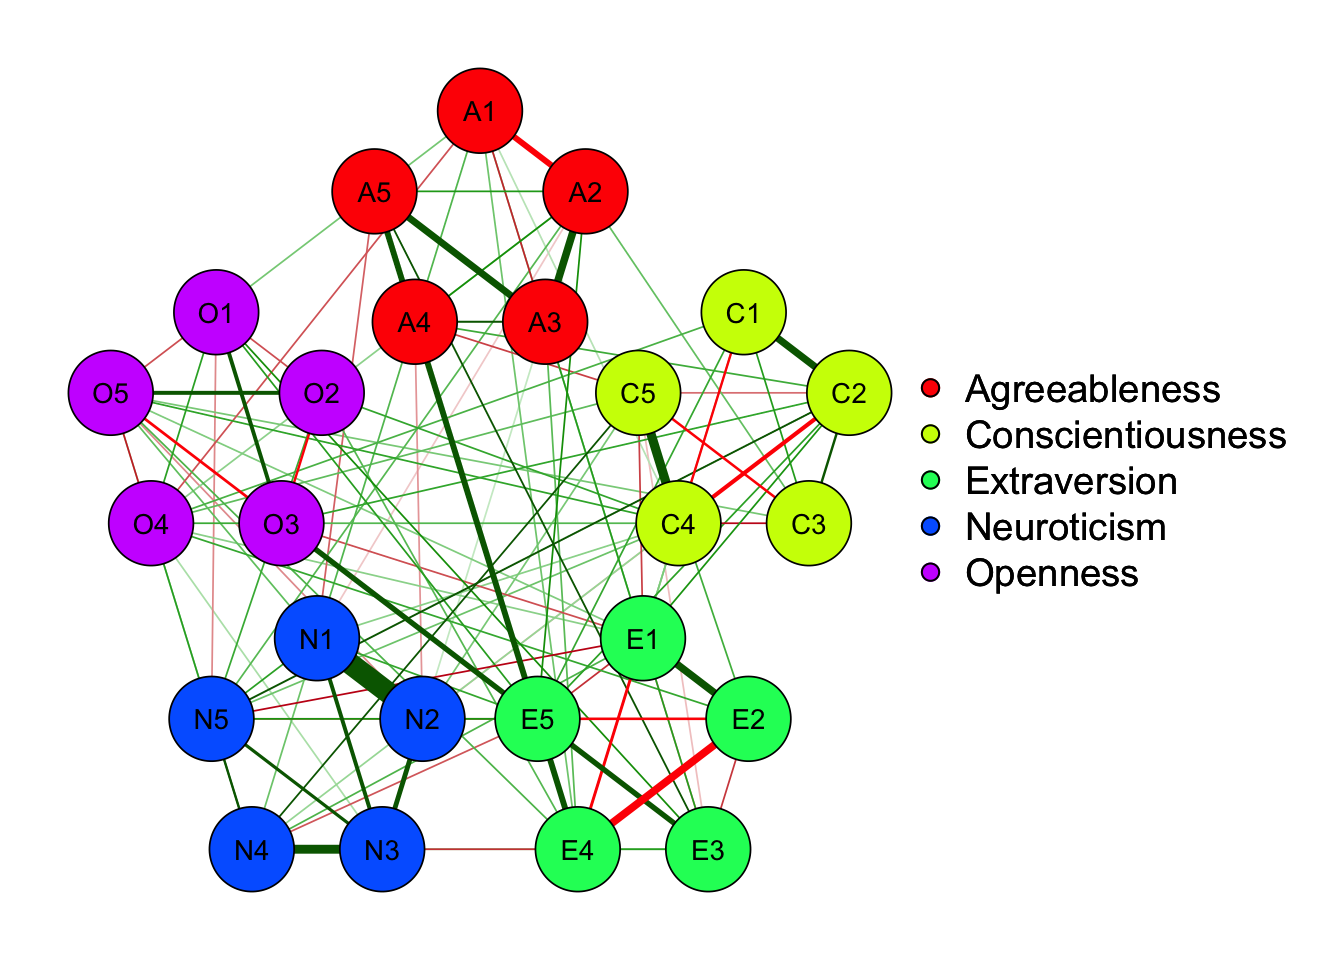
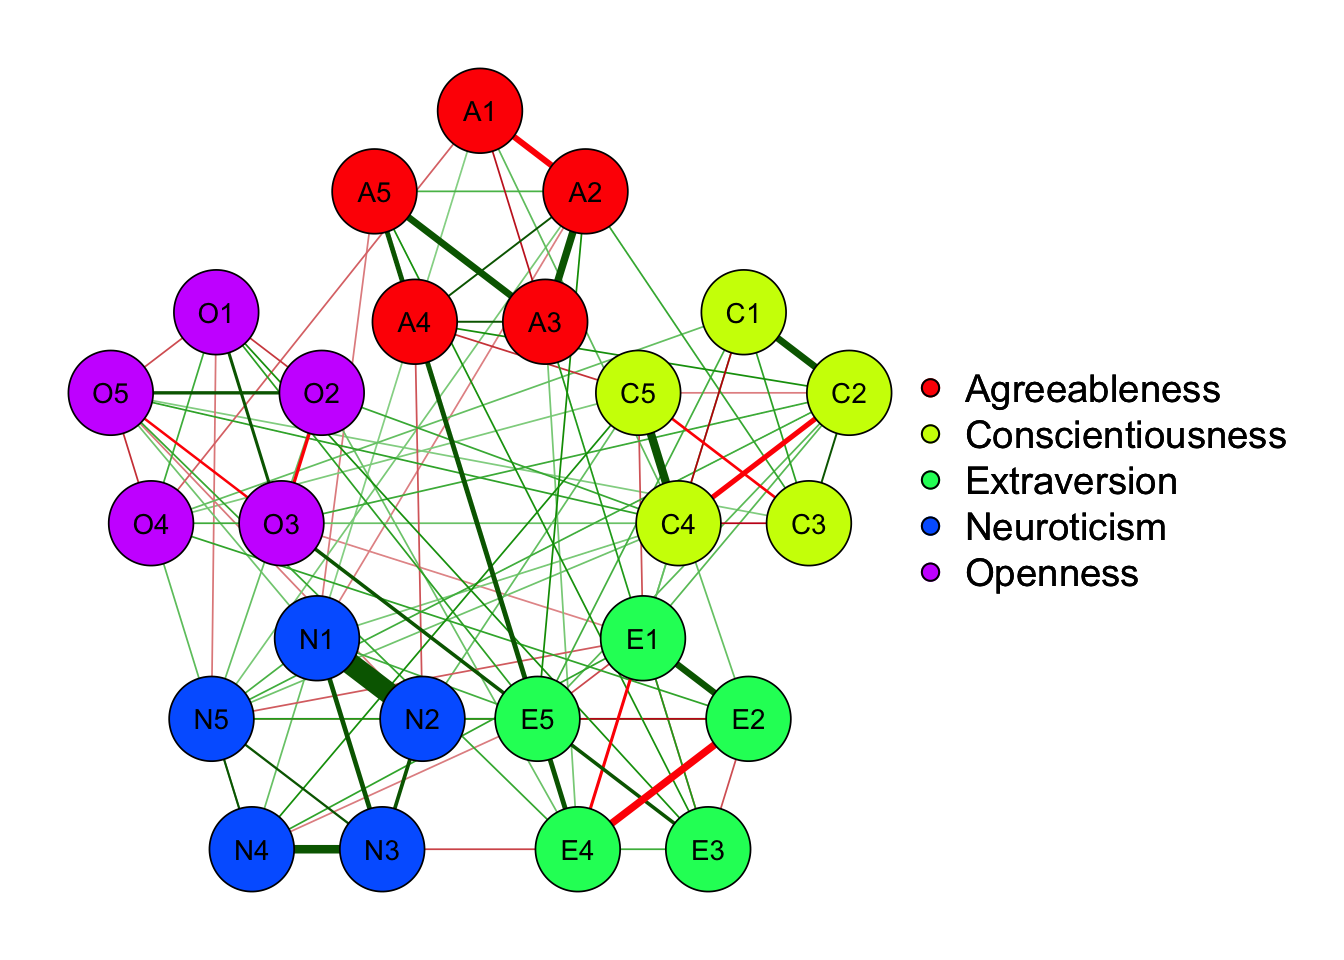
Network Structure
EBICglasso
Sig. Test
BF
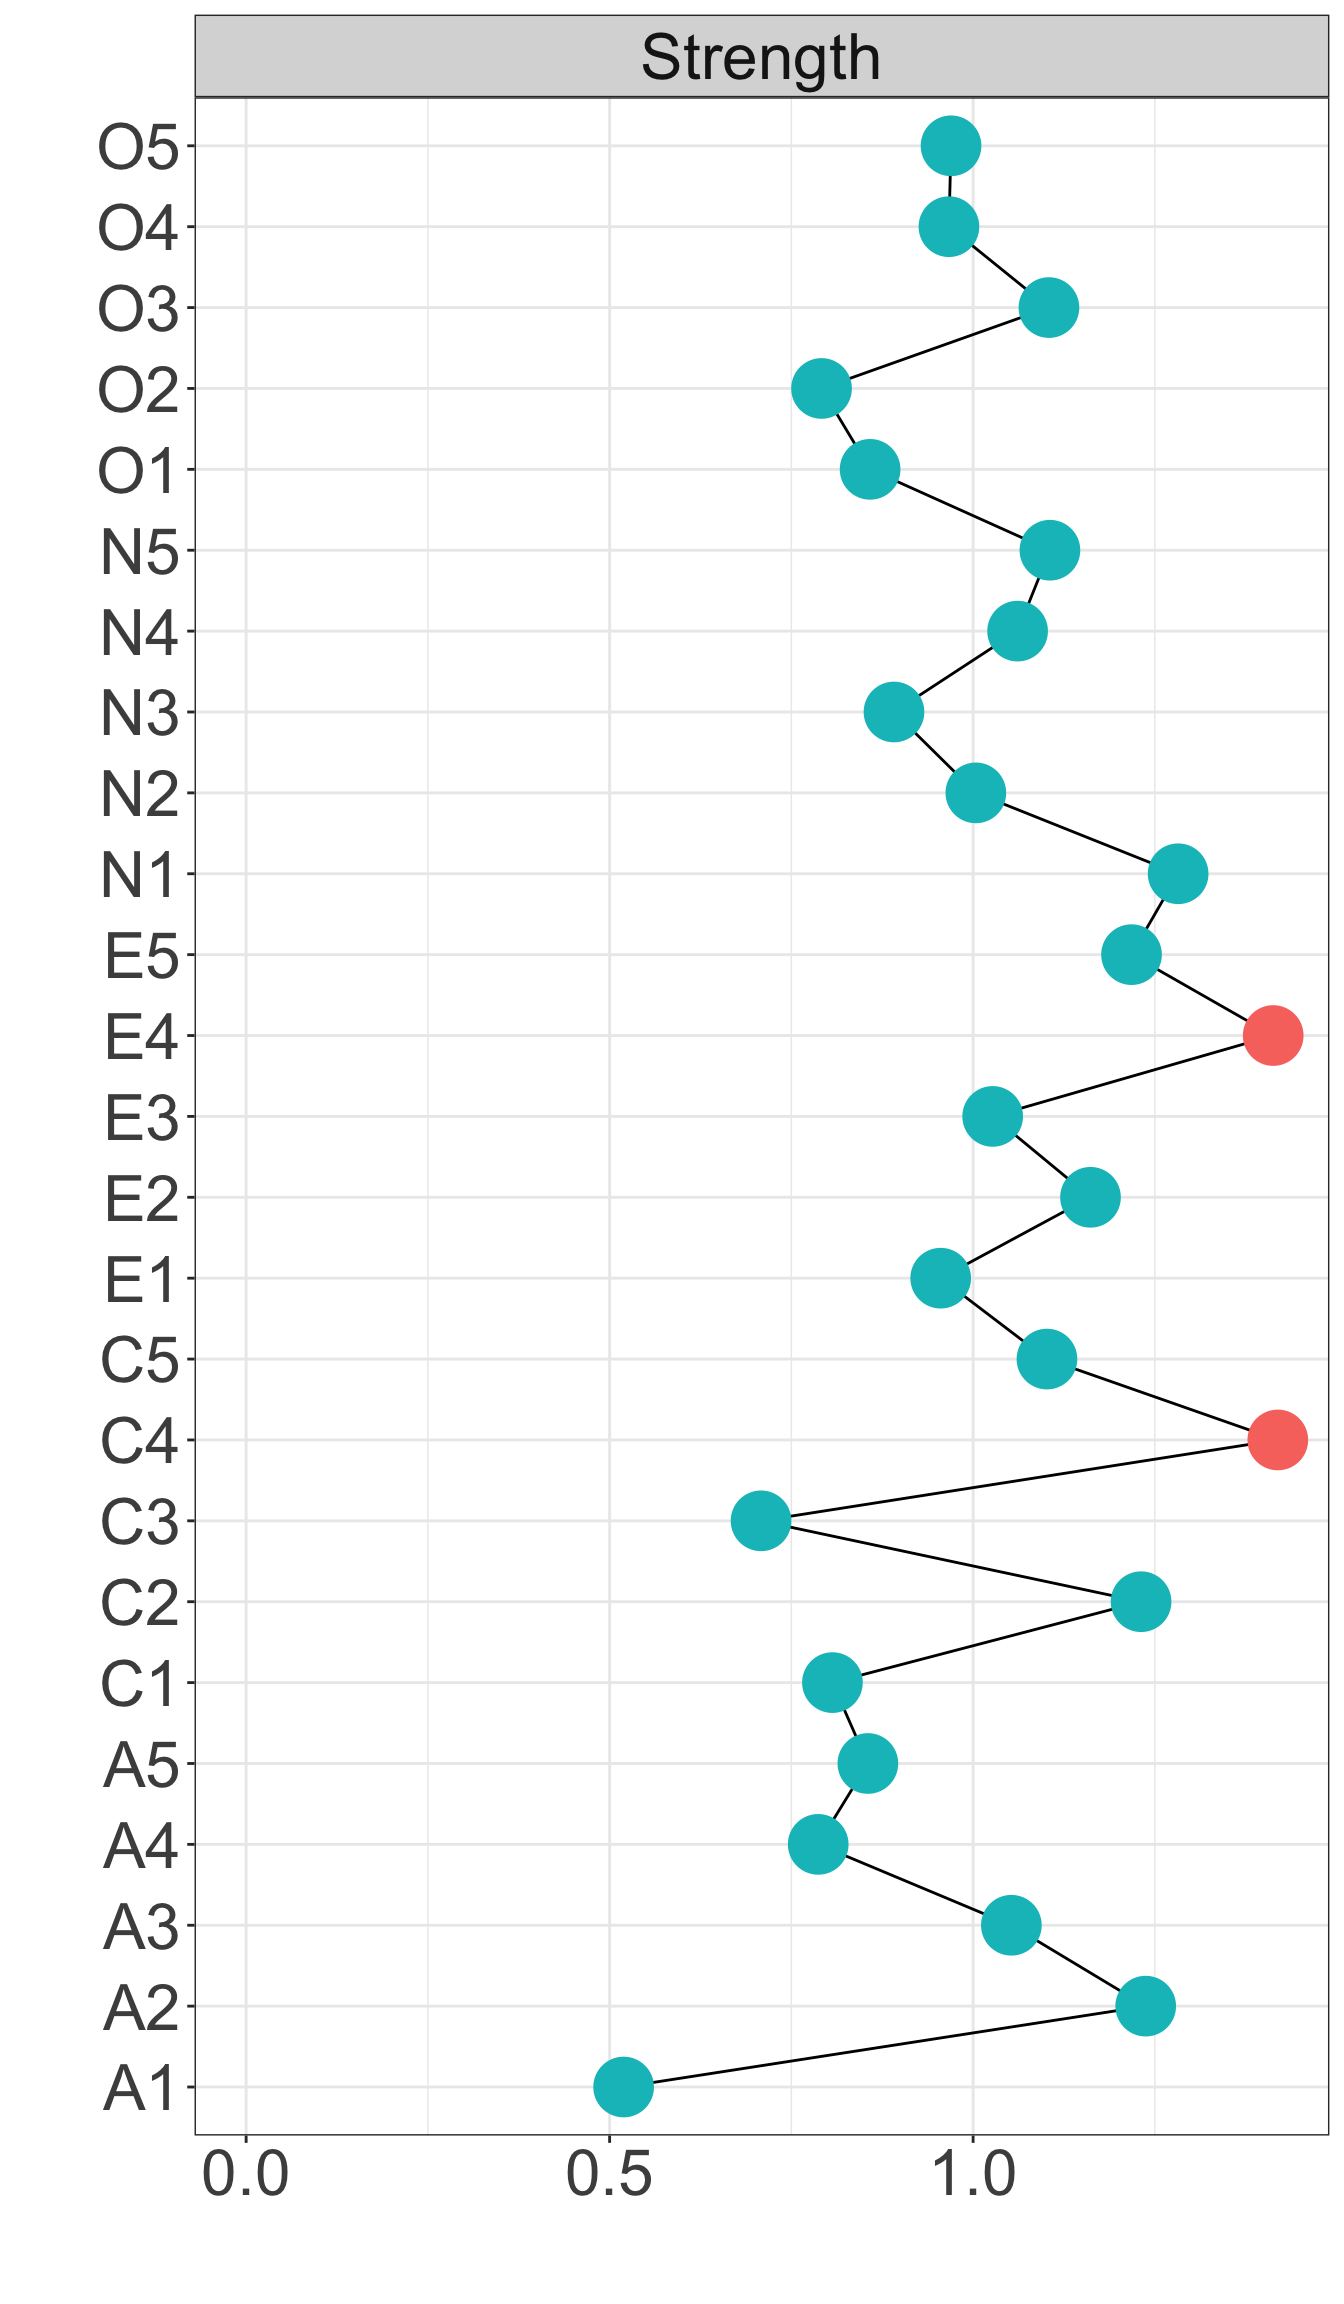
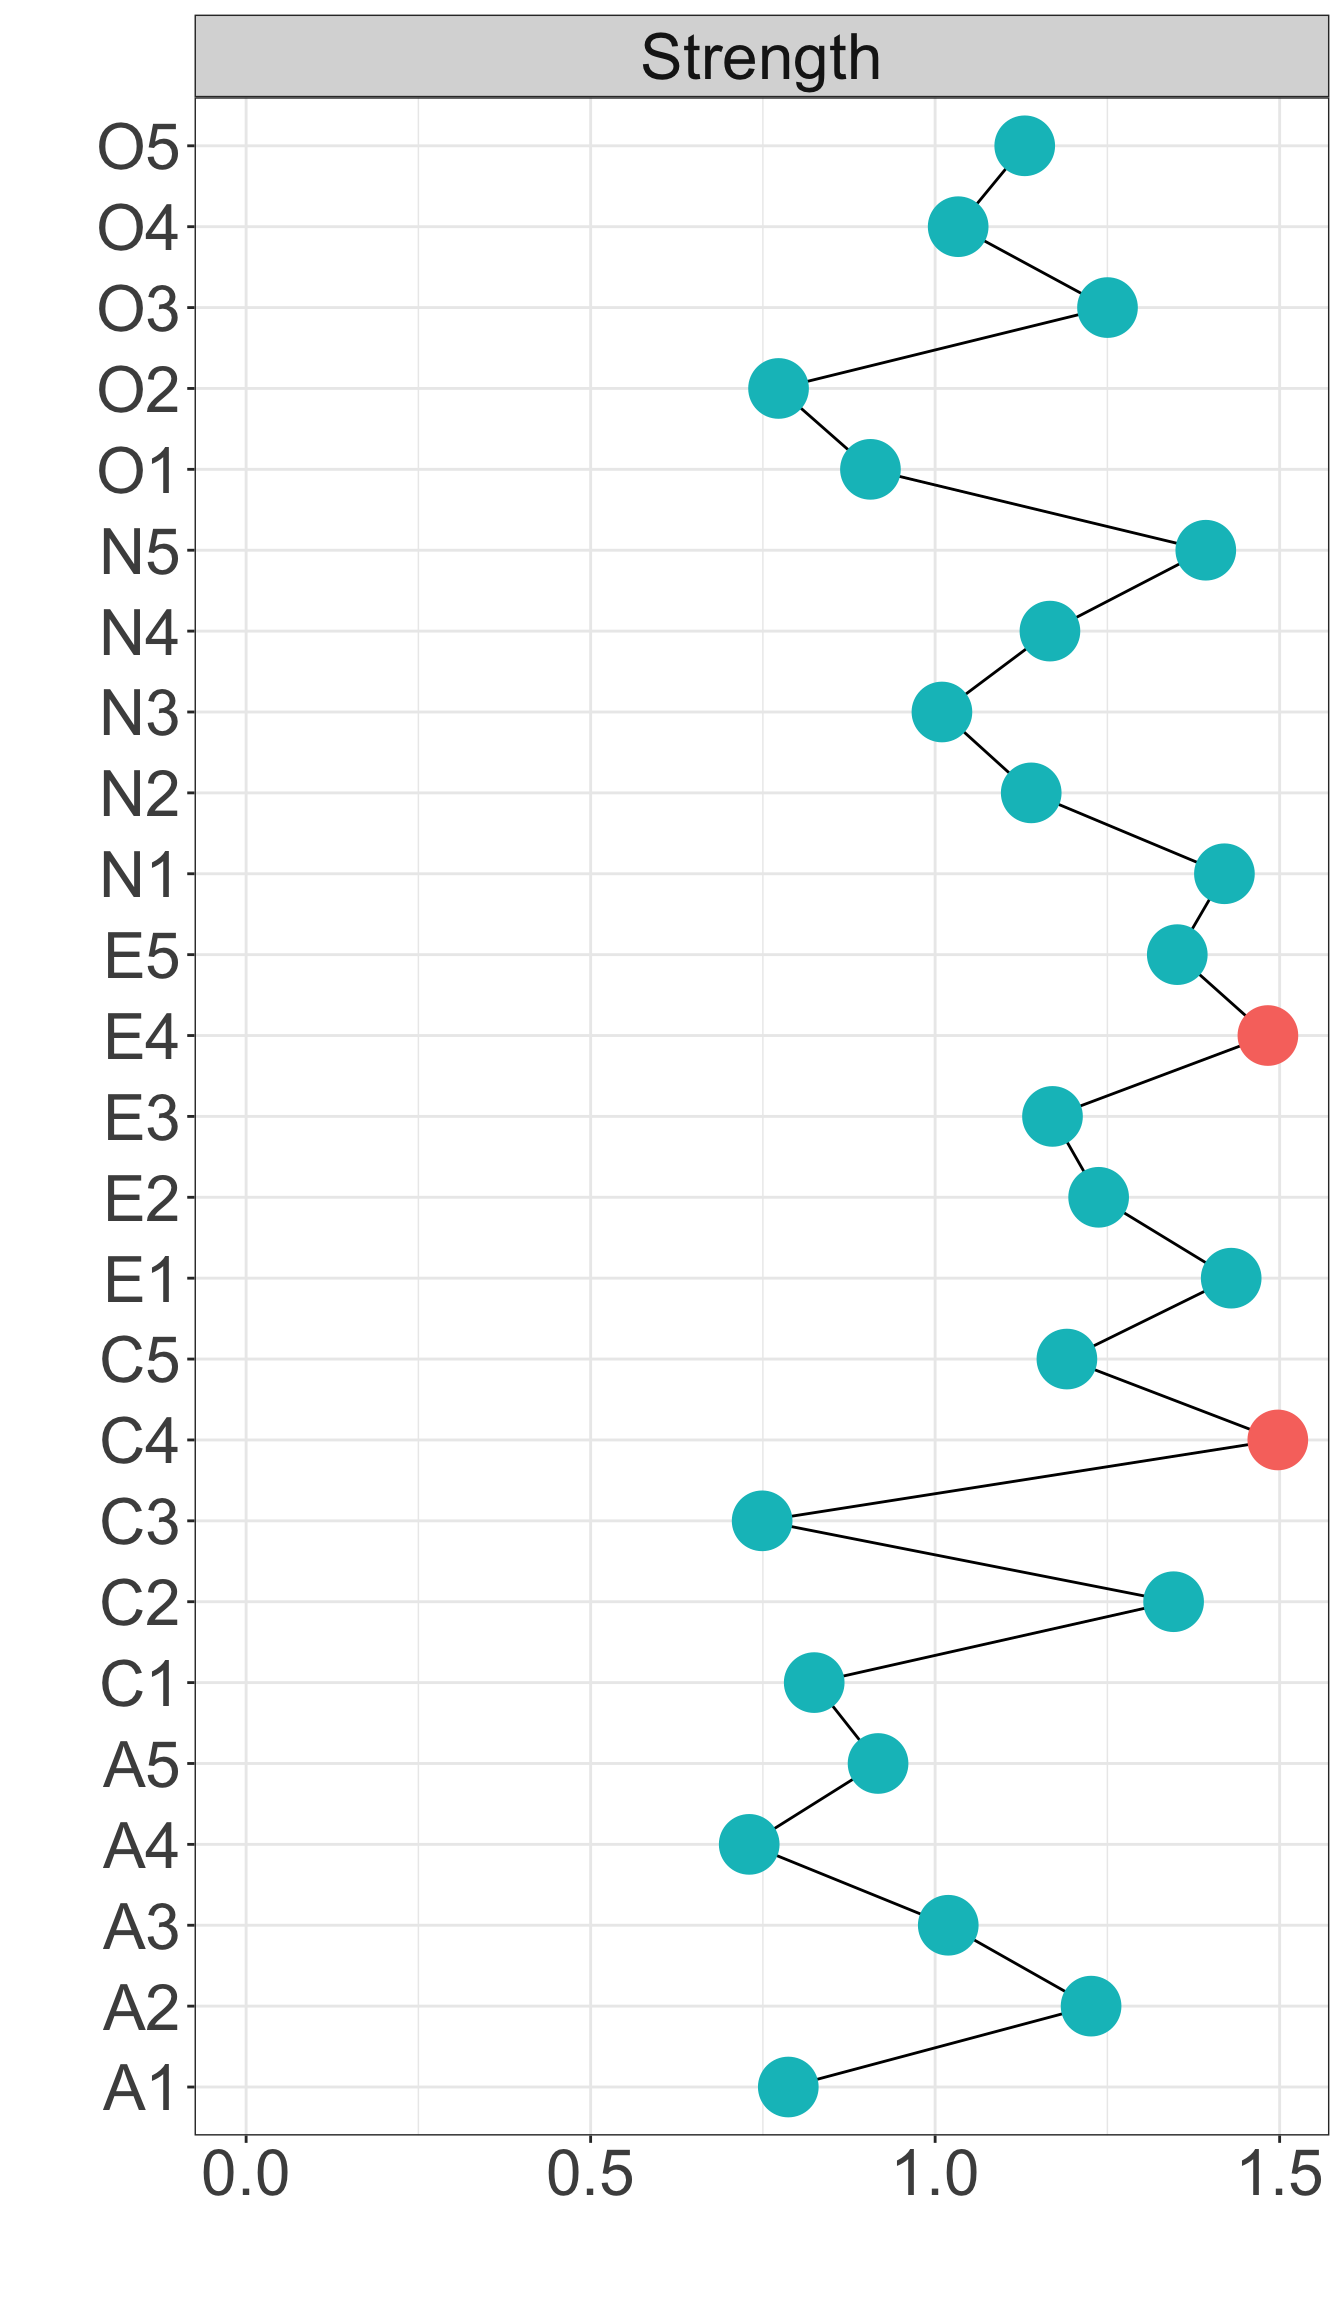
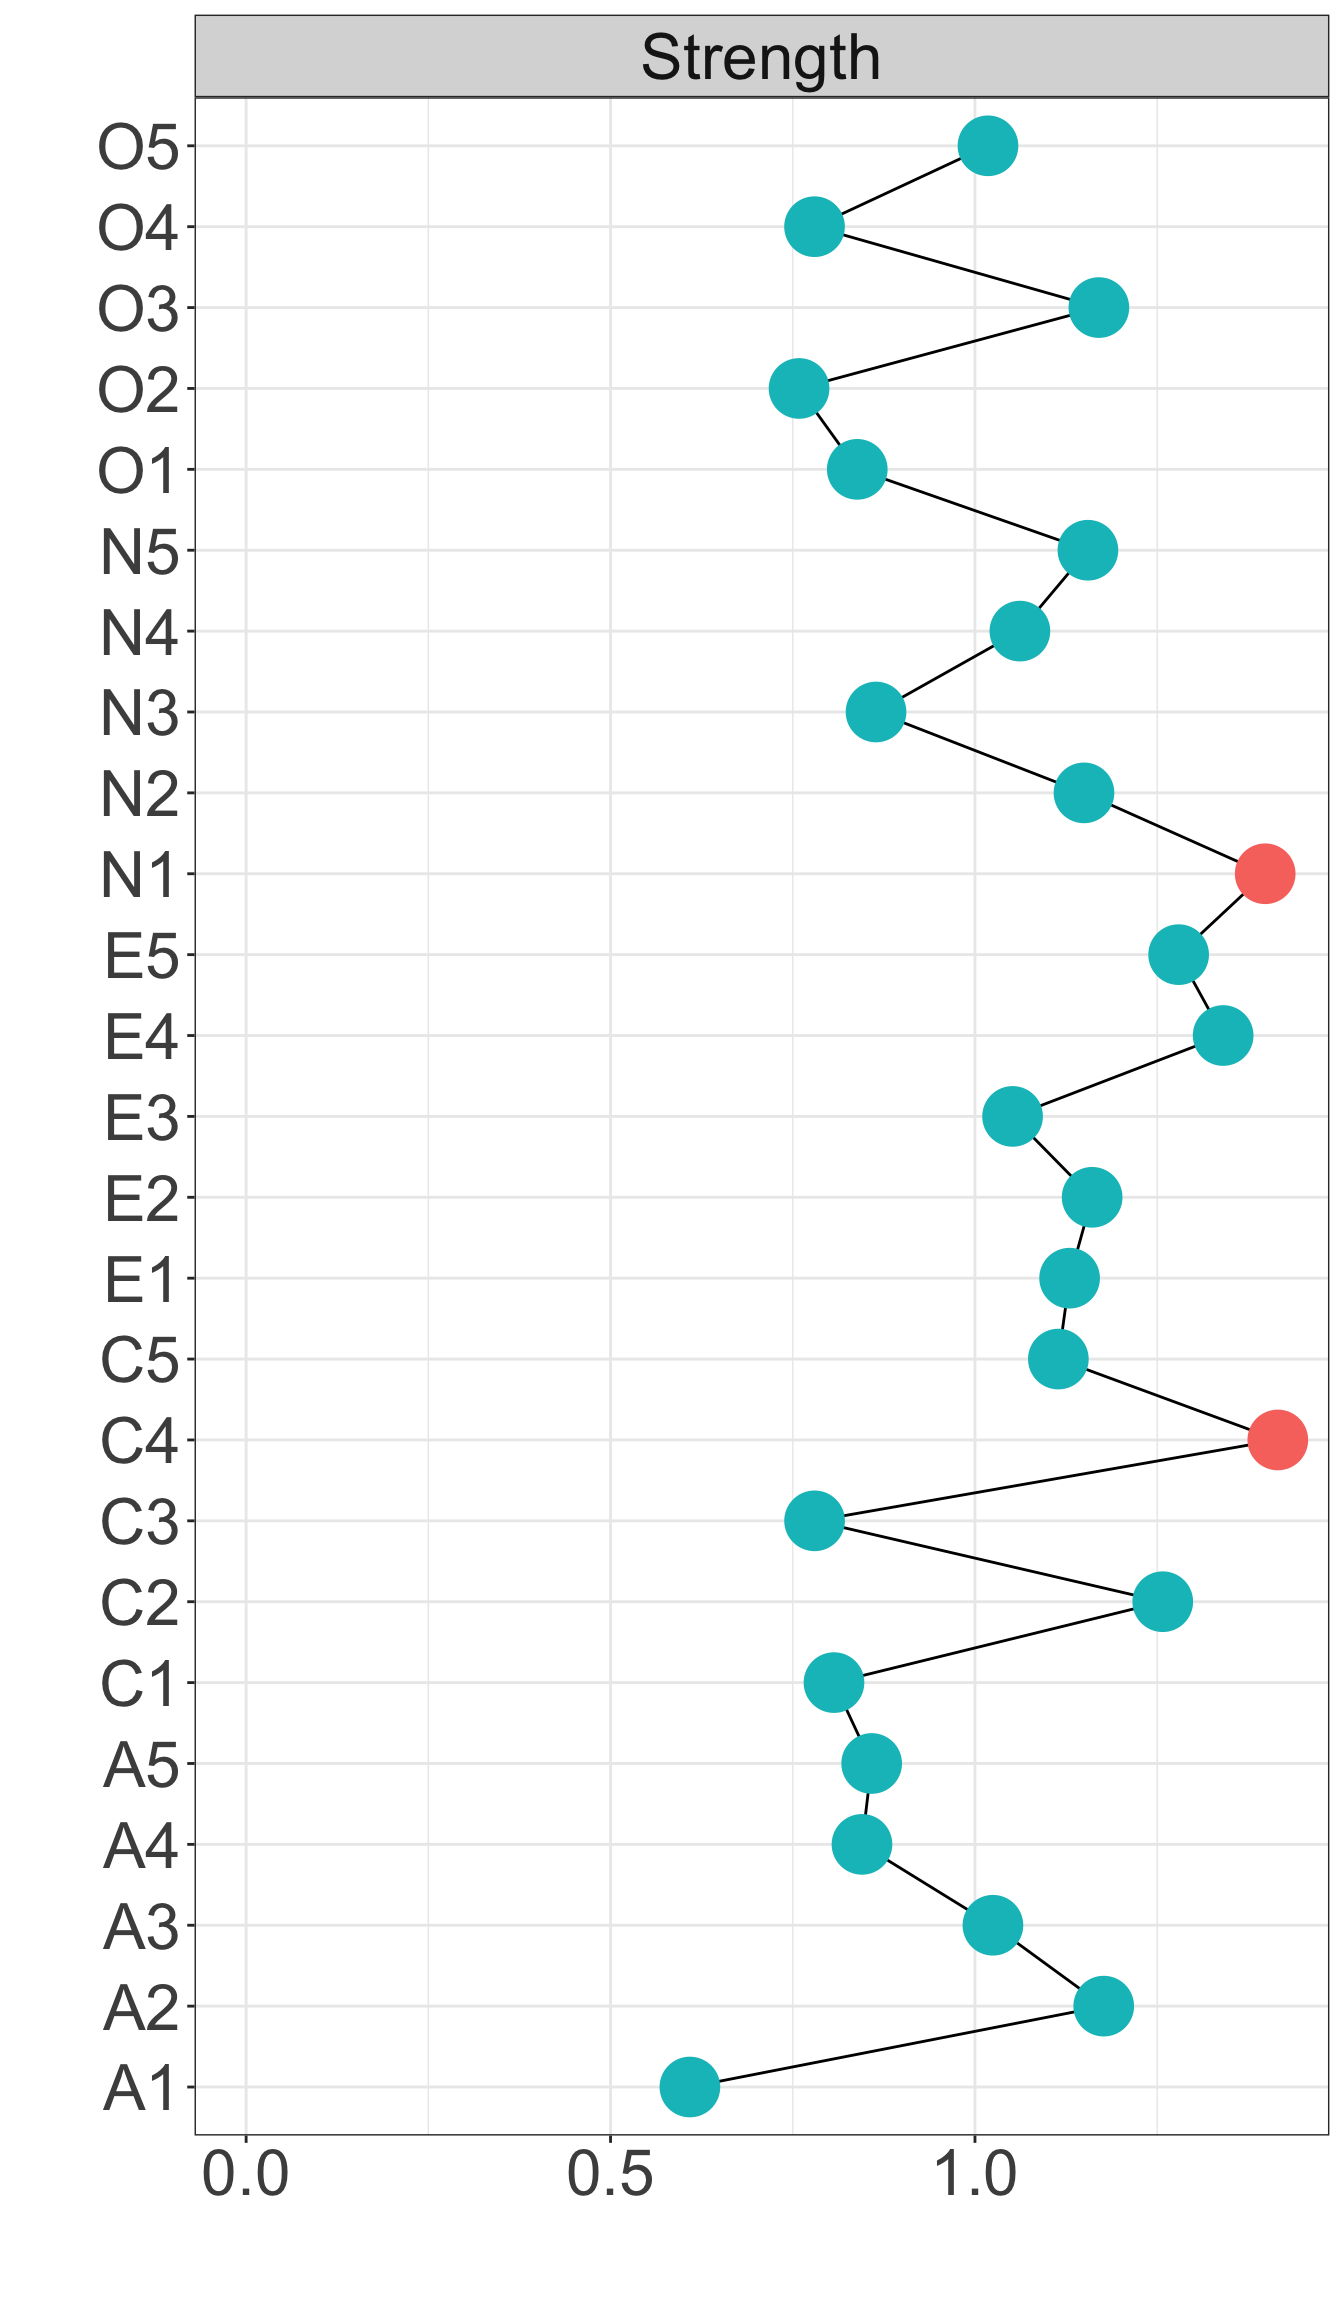
Centrality - Strength
Strength centrality measures suggest that C4 and E4 or N1 have highest centrality indicating they play most imporatant roles in the networks.
Method 1: EBICglasso
Method 2: Sig. Test
Method 3: Bayes Factor
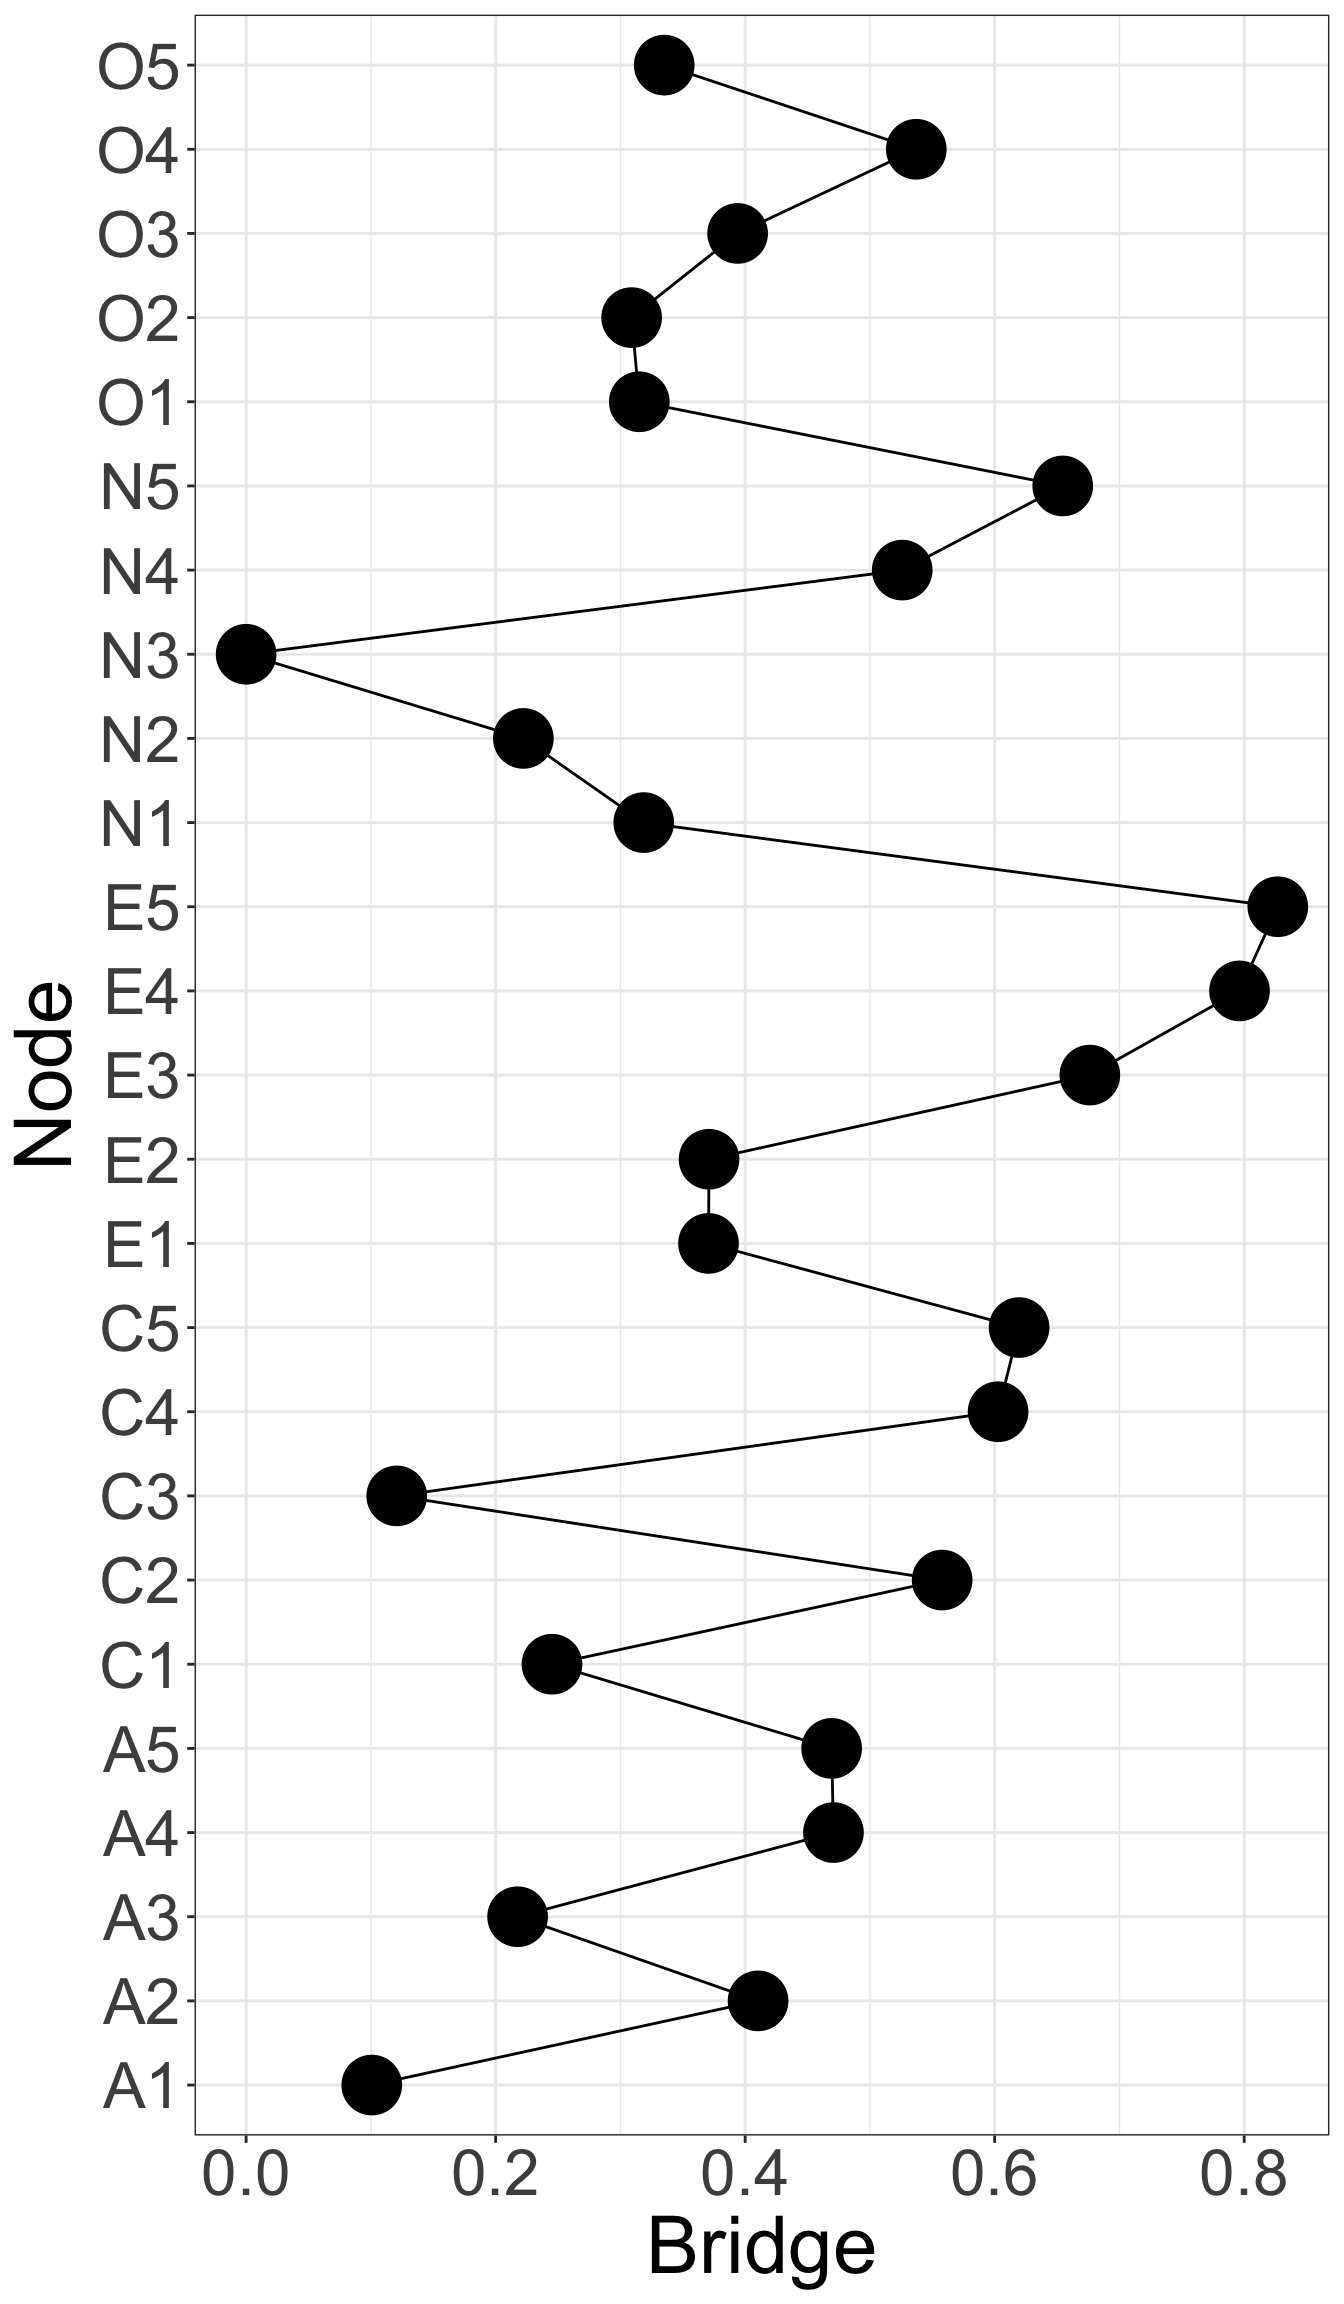
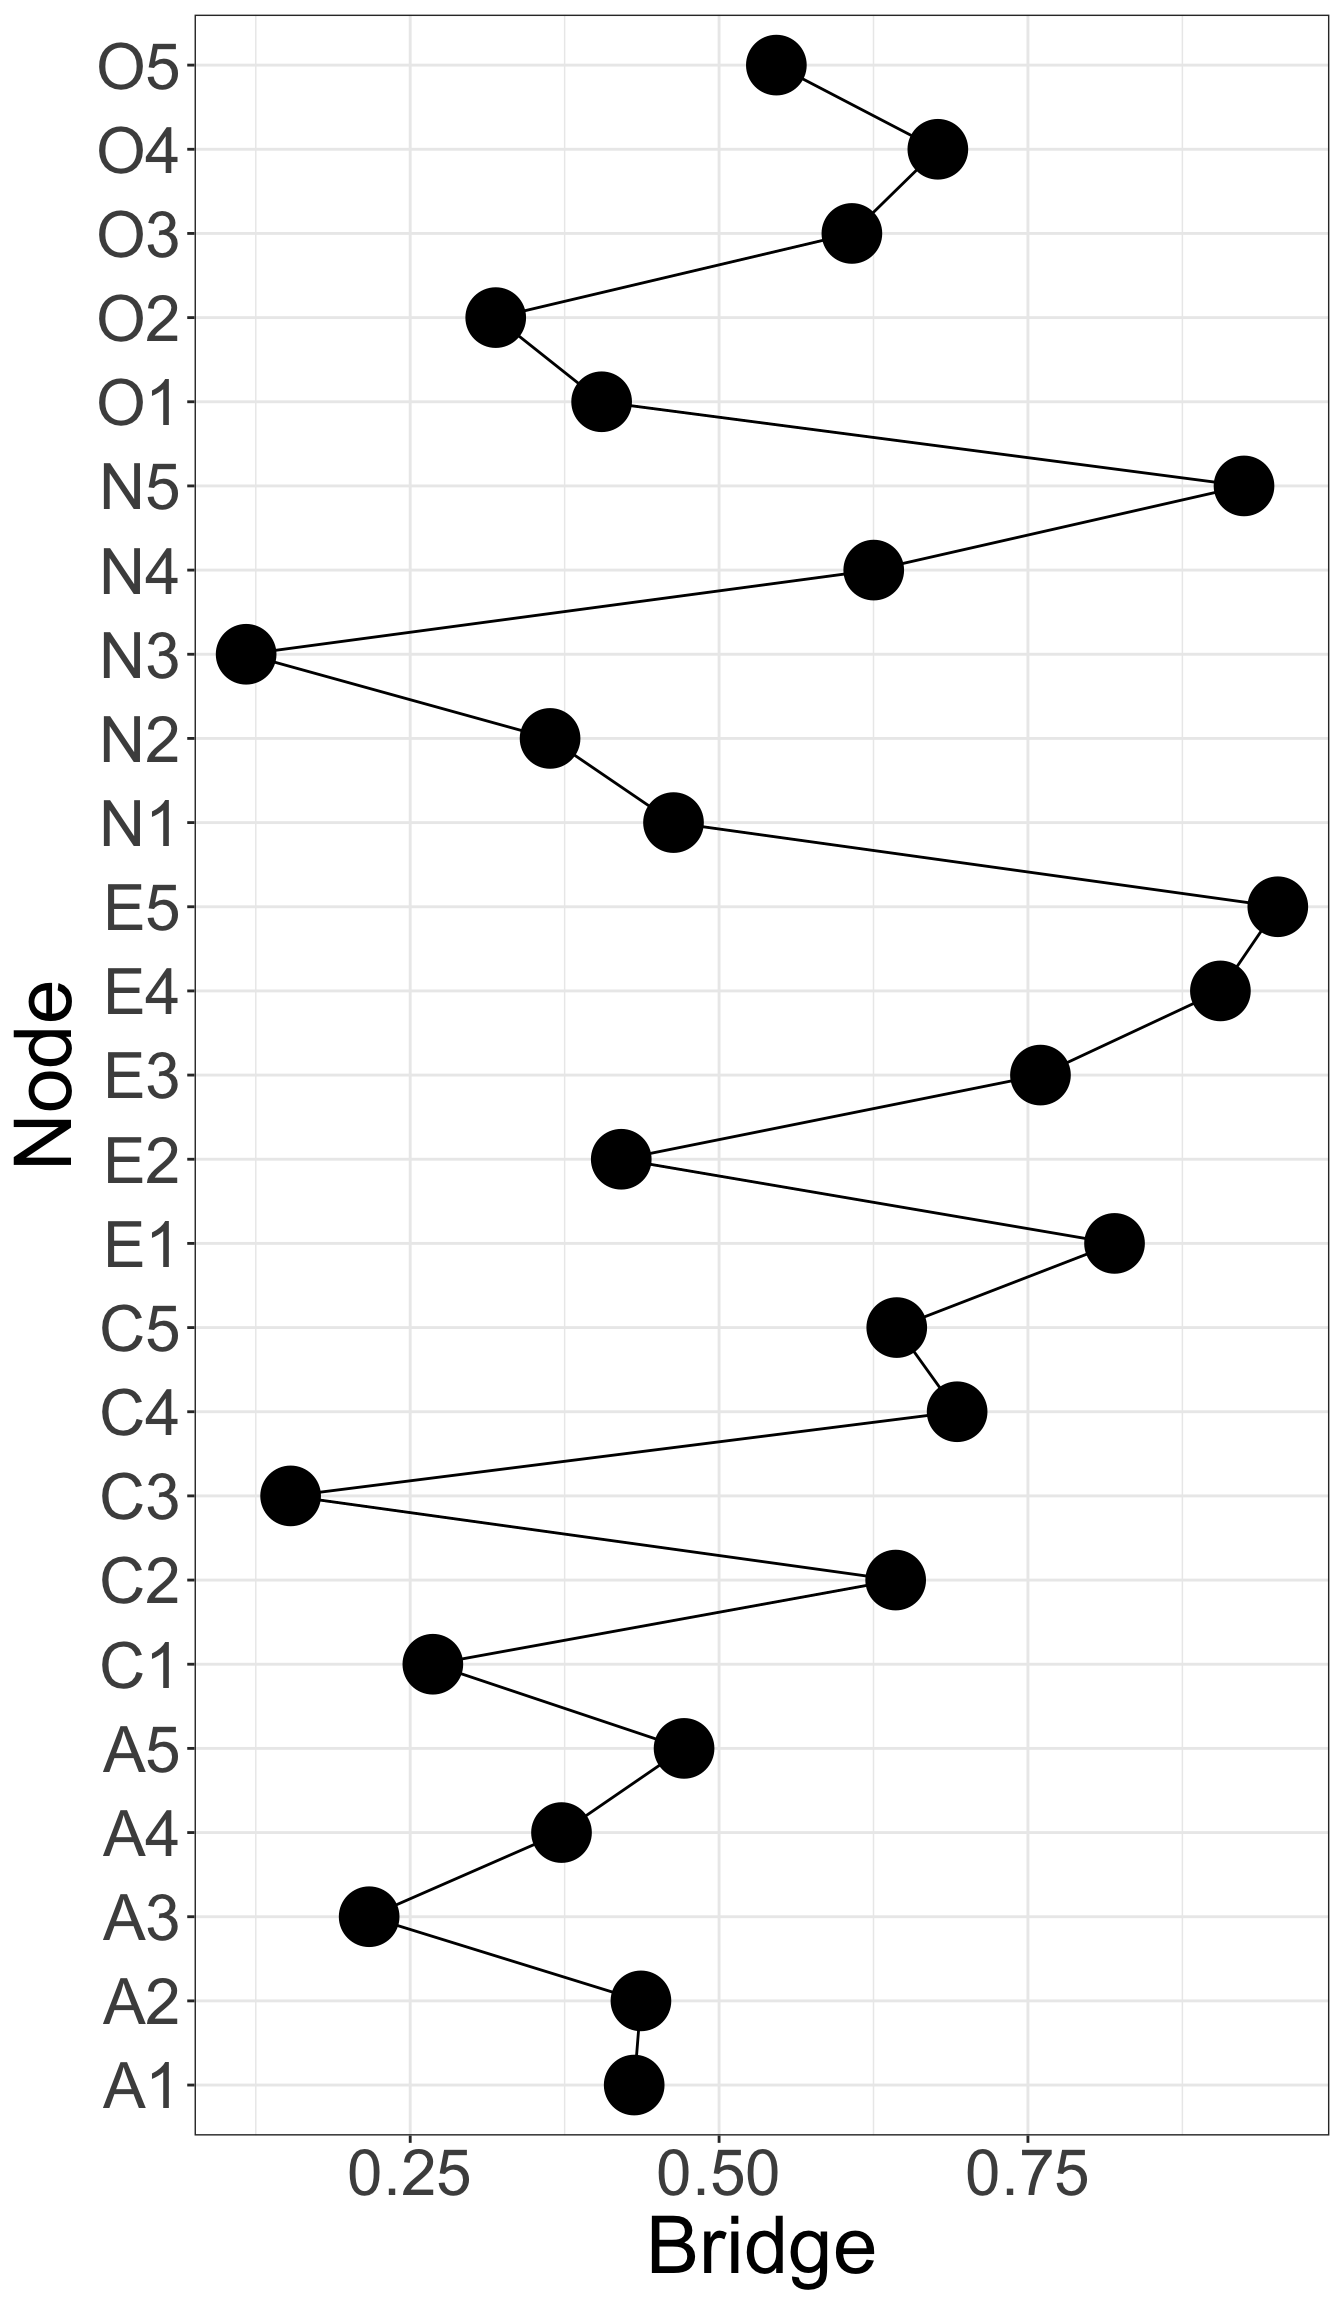
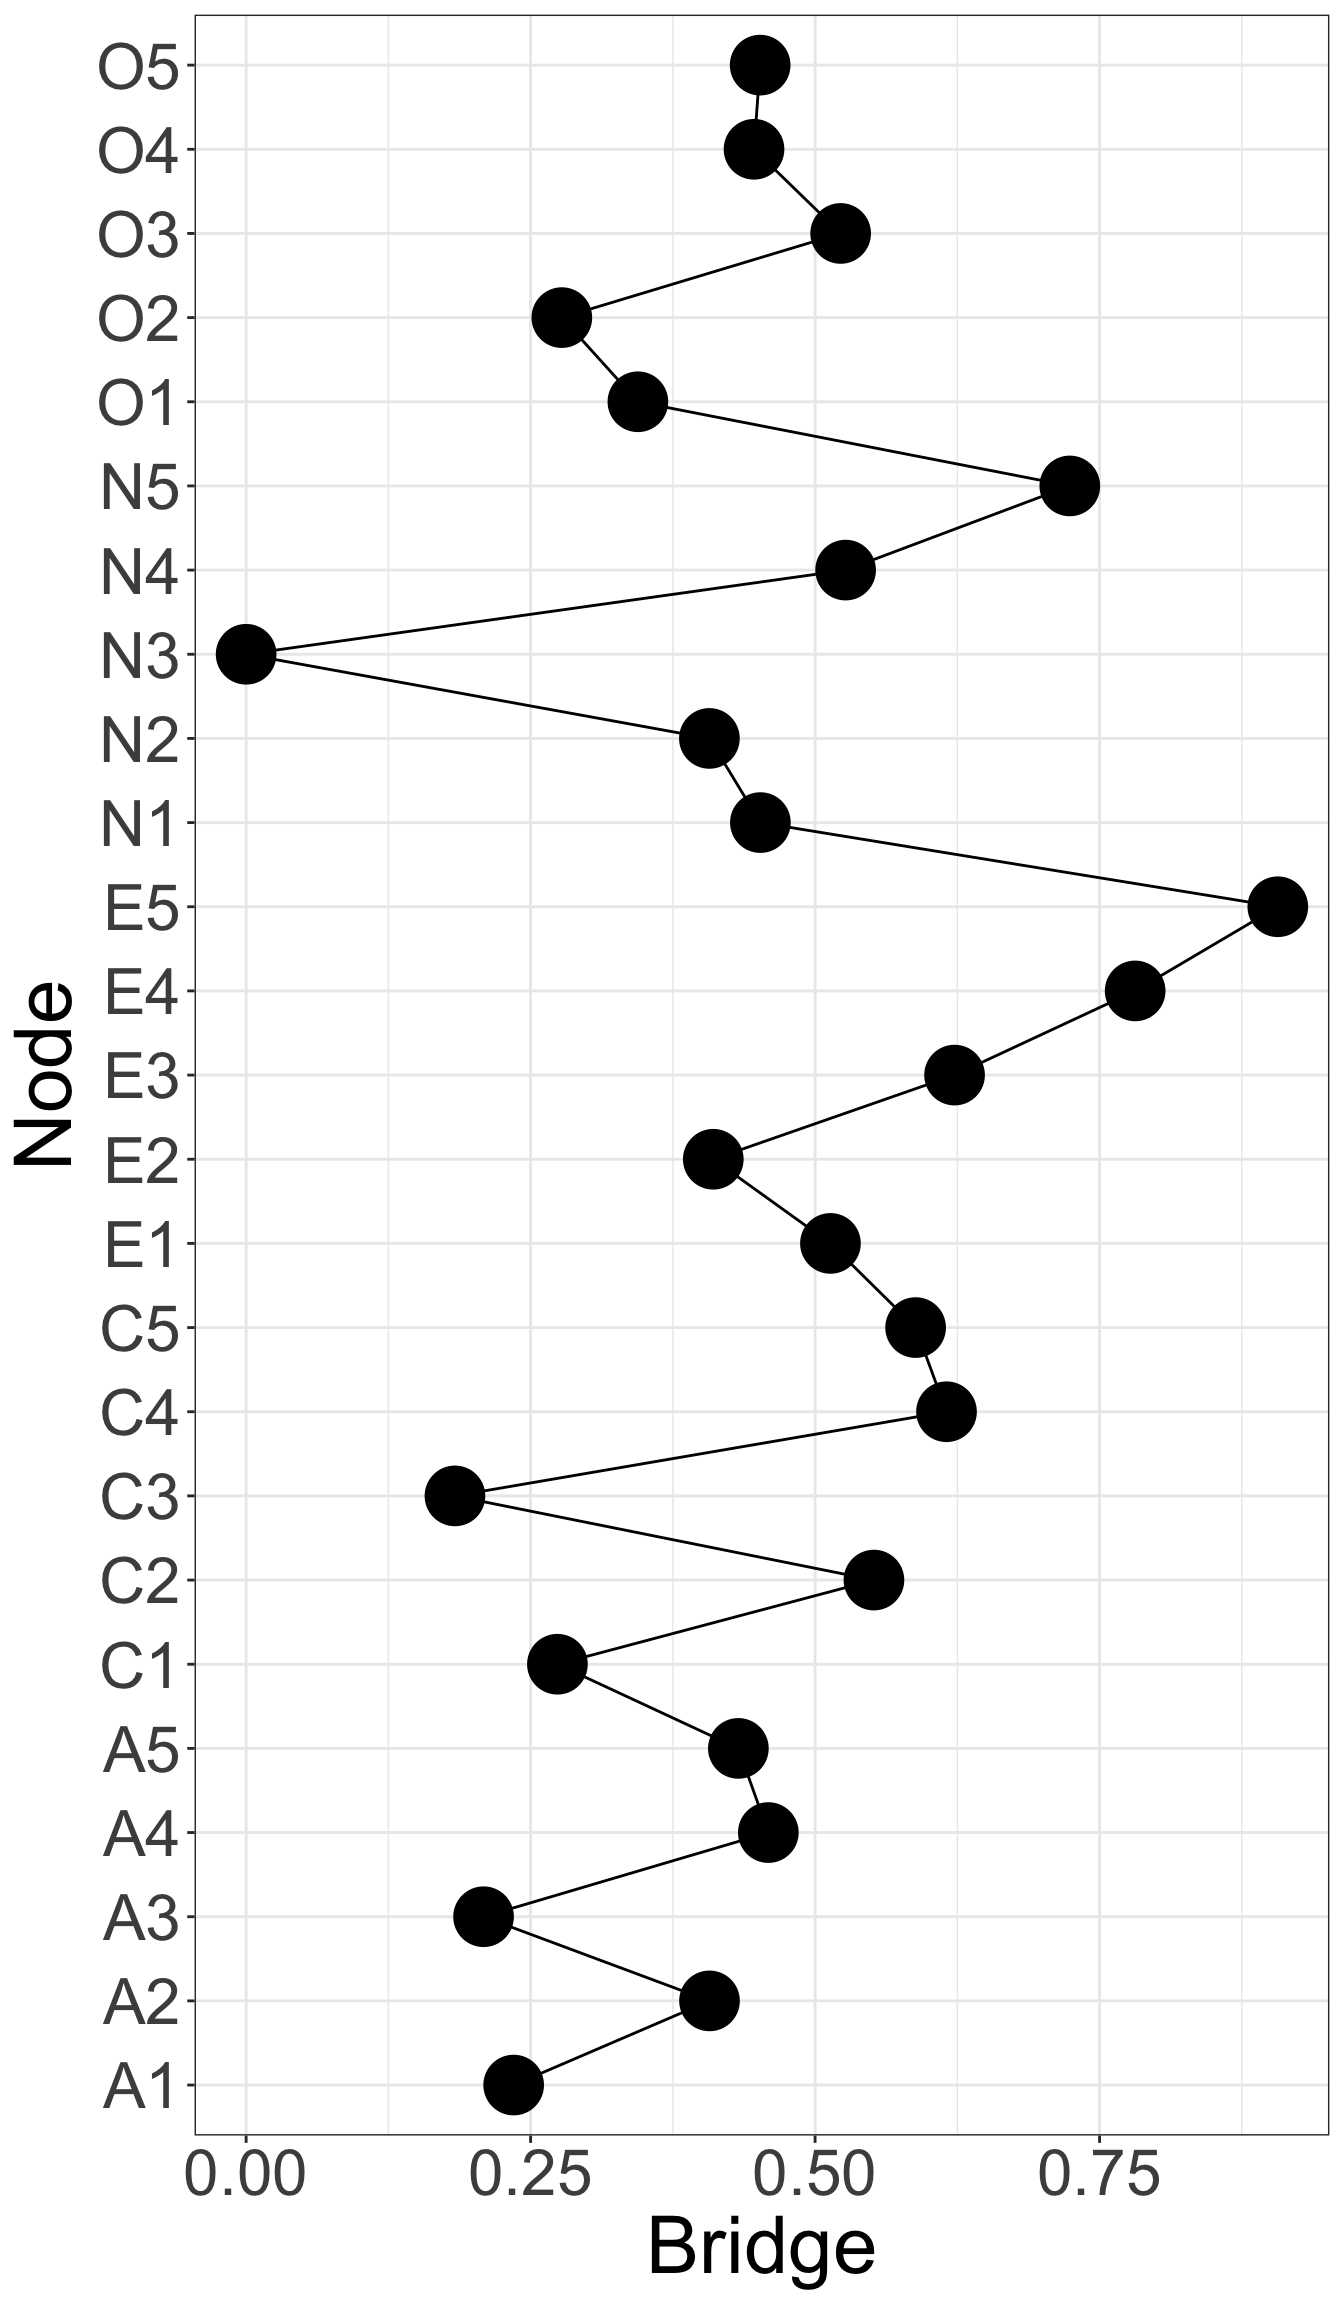
Centrality - Bridge
E4 and E5 has highest bridge strength, indicating they serve as bridges linking communities of personality. They are important elements connecting varied types of personality
Method 1: EBICglasso
Method 2: Sig. Test
Method 3: Bayes Factor
Wrapping up
Network analysis is an alternative way of modeling dependency among variables.
Gaussian graphical model is used for multivariate continuous data.
The goal is to estimate network structure, node importance, and stability.
Kan, Kees-Jan, Han L. J. van der Maas, and Stephen Z. Levine. 2019. “Extending Psychometric Network Analysis: Empirical Evidence Against g in Favor of Mutualism?”Intelligence 73 (March): 52–62. https://doi.org/10.1016/j.intell.2018.12.004.
Li, Jia, and Jihong Zhang. 2024. “Personality Traits and Depressive Symptoms Among Chinese Older People: A Network Approach.”Journal of Affective Disorders 351 (April): 74–81. https://doi.org/10.1016/j.jad.2024.01.215.