```{r}
#| eval: true
theta = 3 * 4
beta = theta + 2
print(beta)
```
[1] 14Jihong Zhang ![]()
To render and preview, execute the Quarto: Preview command. You can alternatively use the Cmd+Shift+K keyboard shortcut.
Use cmd+shift+i to create new code cell.
```{r}
#| eval: true
theta = 3 * 4
beta = theta + 2
print(beta)
```[1] 14```{python}
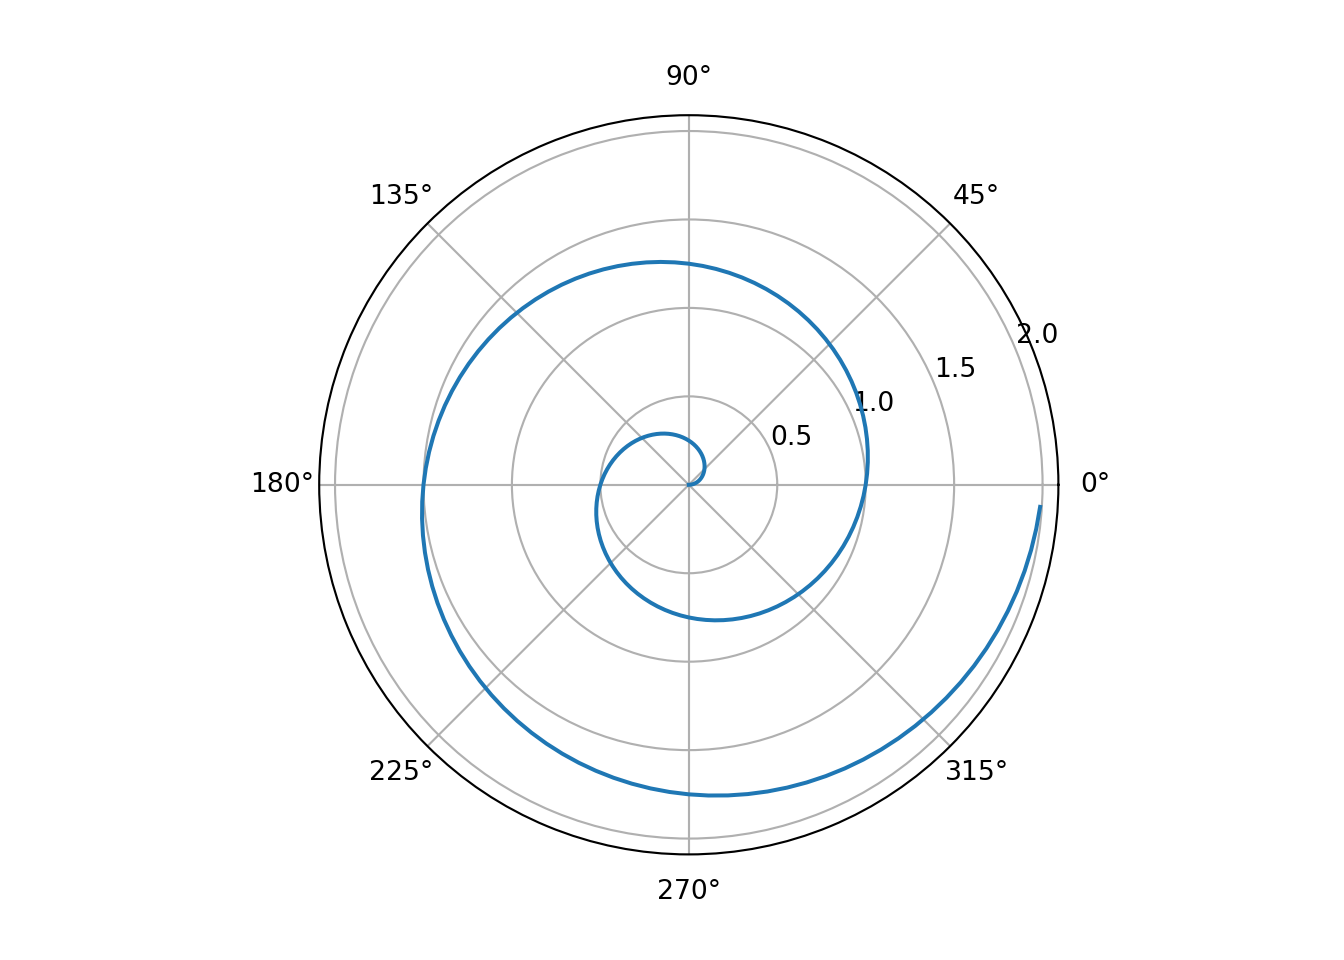
#| label: fig-polar
#| fig-cap: "A line plot on a polar axis"
import numpy as np
import matplotlib.pyplot as plt
r = np.arange(0, 2, 0.01)
theta = 2 * np.pi * r
fig, ax = plt.subplots(
subplot_kw = {'projection': 'polar'}
)
ax.plot(theta, r)
ax.set_rticks([0.5, 1, 1.5, 2])
ax.grid(True)
plt.show()
```
Similar to RStudio, use the ⇧⌘ F4 keyboard shortcut to switch to Visual Editing Mode.
Do not use jupyter: python3. Instead, leave it blank to execute both R and Python and output.