Publications | Jihong Zhang
2026
- Zhang, J., Liang, X., Deng, A., Bonge, N., Tan, L., Zhang, L., & Zarrett, N. (2026). Leveraging Interview-Informed LLMs to Model Survey Responses: Comparative Insights from AI-Generated and Human Data. Journal of Educational Data Mining. 18 (1)
2025
- Jiang, Z., Zhang, J., Liu, Y., Ouyang, J., Sun, L., & Guo, H. (2025). ShinyDegSEM: an interactive application for pathway perturbation analysis in gene expression studies via structural equation modeling. PeerJ. 13, e20033
- Lin, Y., Ren, Y., Barnhart, WR., Cui, T., Zhang, J., & He, J. (2025). The connections among problematic usage of the internet, psychological distress, and eating disorder symptoms: A longitudinal network analysis in Chinese adolescents. International Journal of Mental Health and Addiction. 23 (3), 1991-2003
- Wang, Y., Zhang, J., & Pellicioni, MS. (2025). Math anxiety is associated with skipping problems and less help-seeking behavior after error commission. Learning and Individual Differences. 120, 102681
- Wang, Y., Zhao, Y., Zhang, J., Man, K., & Lu, J. (2025). Fostering autonomous motivation in first-year college students: A self-determination theory-based online intervention. Learning and Motivation. 90, 102118
- Liang, X., Li, J., Garnier-Villarreal, M., & Zhang, J. (2025). Comparing Frequentist and Bayesian Methods for Factorial Invariance with Latent Distribution Heterogeneity. Behavioral Sciences. 15 (4), 482
- Zhang, J., Cui, S., Xu, Y., Cui, T., Barnhart, WR., Ji, F., Nagata, JM., & He, J. (2025). Introducing diagnostic classification modeling as an unsupervised method for screening probable eating disorders. Assessment. 32 (3), 405-416
- Zhao, M., Ai, J., Zhang, J., & Peng, Y. (2025). The Relationship Among Teachers’ Characteristics, Self-Efficacy and Attitudes towards Inclusive Education Among Chinese Preschool Teachers. International Journal of Disability, Development and Education. 1-16
- Wei, X., Zhang, S., & Zhang, J. (2025). Digital Pencil Usage and Mathematics Performance Among Students with Learning Disabilities and Their General Education Peers. Journal of Special Education Technology. 01626434251314041
- Zarrett, N., Deng, A., Yang, CH., & Zhang, J. (2025). Translation of the connect through PLAY physical activity intervention for underserved youth from in-person to virtual delivery: a feasibility study. Translational Behavioral Medicine. 15 (1), ibaf045
2024
- Zhang, J., Cui, S., Zickgraf, HF., Barnhart, WR., Xu, Y., Wang, Z., Ji, F., Chen, G., & … (2024). A Longitudinal Network Analysis of Emotion Regulation, Interpersonal Problems, and Eating Disorder Psychopathology in Chinese Adolescents. International Journal of Eating Disorders. 57 (12), 2415-2426
- Zhang, J., Templin, J., & Liang, X. (2024). Model Selection Posterior Predictive Model Checking via Limited‐Information Indices for Bayesian Diagnostic Classification Modeling. Journal of Educational Measurement. 61 (4), 740-762
- ZHANG, L., Jackson, H., Yang, S., Qian, X., Carter, R., Diliberto, J., & Zhang, J. (2024). Prototyping A Multi-Agent System to Enhance AI-Human Collaboration in Individualized Education Program Development. **.
- Zhang, J., & Liang, X. (2024). Evaluating General Network Scoring Methods as Alternatives to Traditional Factor Scoring Methods. PsyArXiv Preprints.
- Jiang, Z., Ouyang, J., Shi, D., Shi, D., Zhang, J., Xu, L., & Cai, F. (2024). Customizing Bayesian multivariate generalizability theory to mixed-format tests. Behavior Research Methods. 56 (7), 8080-8090
- Wei, X., Zhang, S., & Zhang, J. (2024). Identifying Student profiles in a digital mental rotation task: Insights from the 2017 NAEP math assessment. Frontiers in Education. 9, 1423602
- Ji, F., Sun, H., Barnhart, WR., Cui, T., Cui, S., Zhang, J., & He, J. (2024). Psychometric network analysis of the Intuitive Eating Scale‐2 in Chinese general adults. Journal of Clinical Psychology. 80 (5), 1098-1114
- Li, J., & Zhang, J. (2024). Personality Traits and Depressive Symptoms Among Chinese Older People: A Network Approach. Journal of Affective Disorders. 351, 74-81
- Jiang, Z., Han, Y., Xu, L., Shi, D., Zhang, J., Liang, H., & Ouyang, J. (2024). Empirical ensemble equating under the NEAT design inspired by machine learning ideology. Machine Learning, Natural Language Processing, and Psychometrics. 93
2023
- Wei, X., Zhang, S., Zhang, J., & Yu, J. (2023). Mathematics performance, response time, and enjoyment of eighth-grade autistic students and their general education peers. Autism. 27 (8), 2518-2529
- Ngai, SS., Cheung, CK., Zhou, Q., Zhang, J., Ng, Y., Yu, EN., Zhang, X., & Wong, L. (2023). Hope, career competency, and social well-being among non-engaged youth in Hong Kong: a longitudinal network analysis. Current Psychology. 43 (10), 8947-8962
- He, J., Ji, F., Sun, H., Barnhart, W., Cui, T., Cui, S., & Zhang, J. (2023). Psychometric Network Analysis of the Intuitive Eating Scale-2 in Chinese General Adults. Authorea Preprints.
- Yamaguchi, K., & Zhang, J. (2023). Fully Gibbs sampling algorithms for Bayesian variable selection in latent regression models. Journal of Educational Measurement. 60 (2), 202-234
2022
- Ai, JAJ., Zhang, J., Horn, E., Liu, H., Huang, J., & Ma, Y. (2022). Examination of Chinese teachers’ attitudes towards inclusive education. Journal of the International Special Needs Education. 25 (2), 74-86
- Zhang, J., & JIANG, Z. (2022). gTheoryShiny: An online application for interactive G-theory inference. PsyArXiv.
- Wang, Y., & Zhang, J. (2022). How math anxiety influences challenging math problem-solving behaviors under different autonomy support conditions: an experiment. **. 2022 AERA Annual Meeting
- Han, Y., Zhang, J., Jiang, Z., & Shi, D. (2022). Is the Area Under Curve Appropriate for Evaluating the Fit of Psychometric Models??. Educational and Psychological Measurement. 1-23
- Zhang, J., Templin, J., & Mintz, CE. (2022). A model comparison approach to posterior predictive model checks in Bayesian confirmatory factor analysis. Structural equation modeling: a multidisciplinary journal. 29 (3), 339-349
2021
- Zhang, J., Ackerman, T., & Wang, Y. (2021). 2PL model: Compare generalized linear mixed model with latent variable model based IRT framework. PsyArXiv.
- Wang, Y., Zhang, J., & Lee, H. (2021). An online experiment during COVID-19: Testing the influences of autonomy support toward emotions and academic persistence. Frontiers in Psychology. 12, 747209
- Jiang, Z., Ma, W., Liu, R., Shi, D., & Zhang, J. (2021). Comment on: How sure can we be that a student really failed? On the measurement precision of individual pass-fail decisions from the perspective of item response theory. Medical Teacher. 43 (5), 607-608
- Qin¹, L., Zhang, J., Liang, X., & Pan⁴, Q. (2021). R-squared of a latent interaction in structural equation model: A tutorial of using R. AL JOUR. 10 (3), 69
- Wang, Y., & Zhang, J. (2021). Examining the relationship between cultural intelligence and the academic performance of international students: A structural equation modeling analysis. SCIREA, Journal of Sociology. 5 (1), 25-52
- Zhang, L., Basham, JD., Jr, RA Carter., & Zhang, J. (2021). Exploring Factors Associated with the Implementation of Student-centered Instructional Practices in US classrooms. Teaching and Teacher Education. 99, 103273
- Zhang, L., Jr, RA Carter., Zhang, J., Hunt, TL., Emerling, CR., Yang, S., & Xu, F. (2021). Teacher perceptions of effective professional development: Insights for design. Professional Development in Education. 50 (4), 611-624
2020
- Mintz, CE., Templin, J., & Zhang, J. (2020). Assessment of Item Response Model-Data Fit Via Bayesian Limited Information Model Comparison Posterior Predictive Checks. Multivariate behavioral research. 55 (1), 160-160
- Zhang, J., Templin, J., & Mintz, CE. (2020). A bayesian saturated model approach to posterior predictive model checks in confirmatory factor analysis. Multivariate behavioral research. 55 (1), 161-162
2018
- Zhang, J. (2018). Utilizing Multidimensional Item Response Theory to Examine Social Capital. University of Kansas.
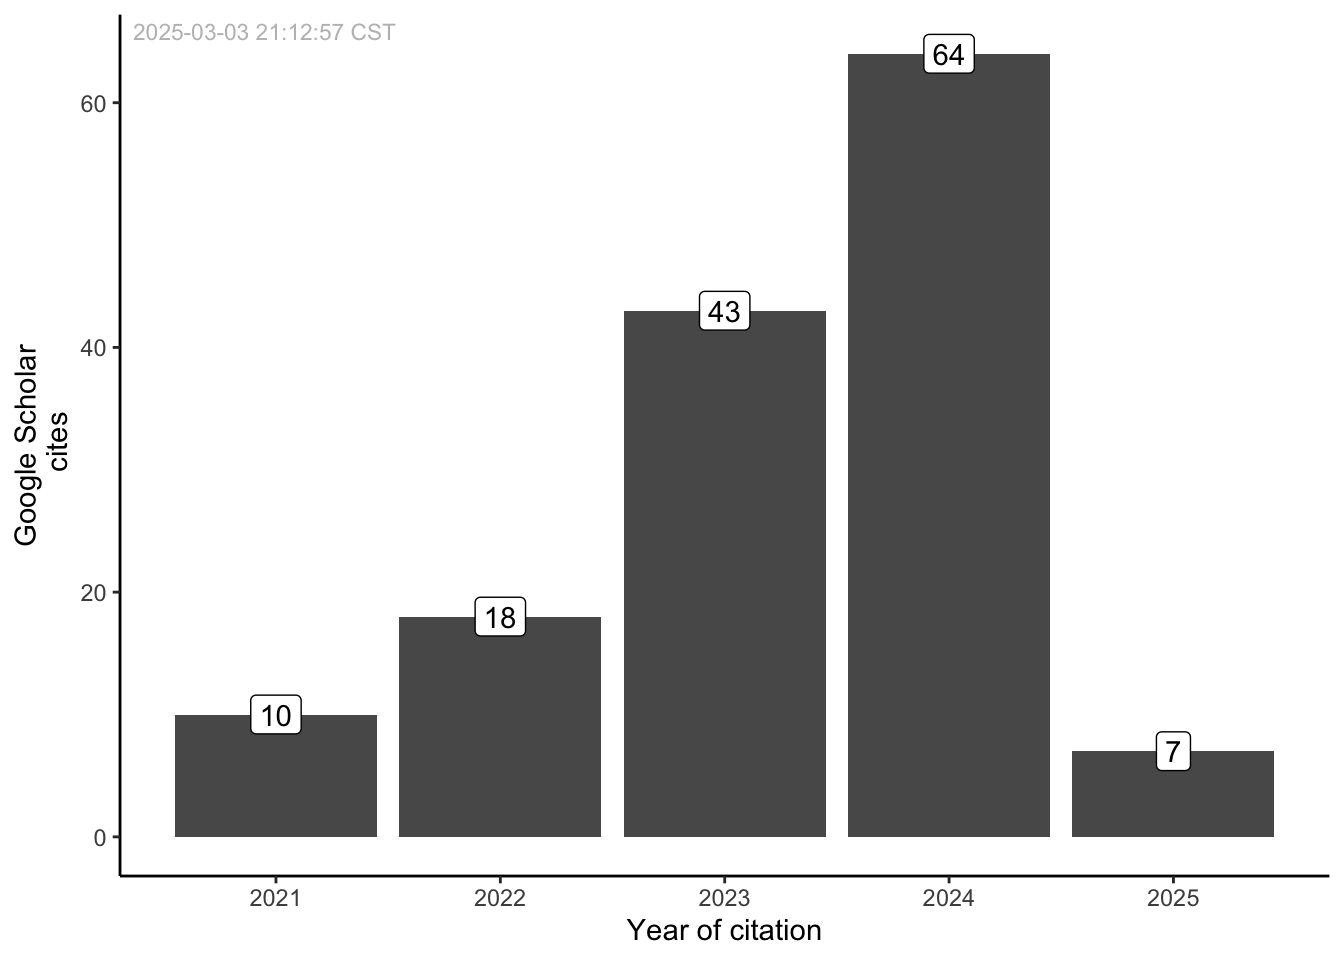
Citations
Figure 1 shows the citations.