Introduce gganimate for Psychometric
R
Tutorial
A new R packge (
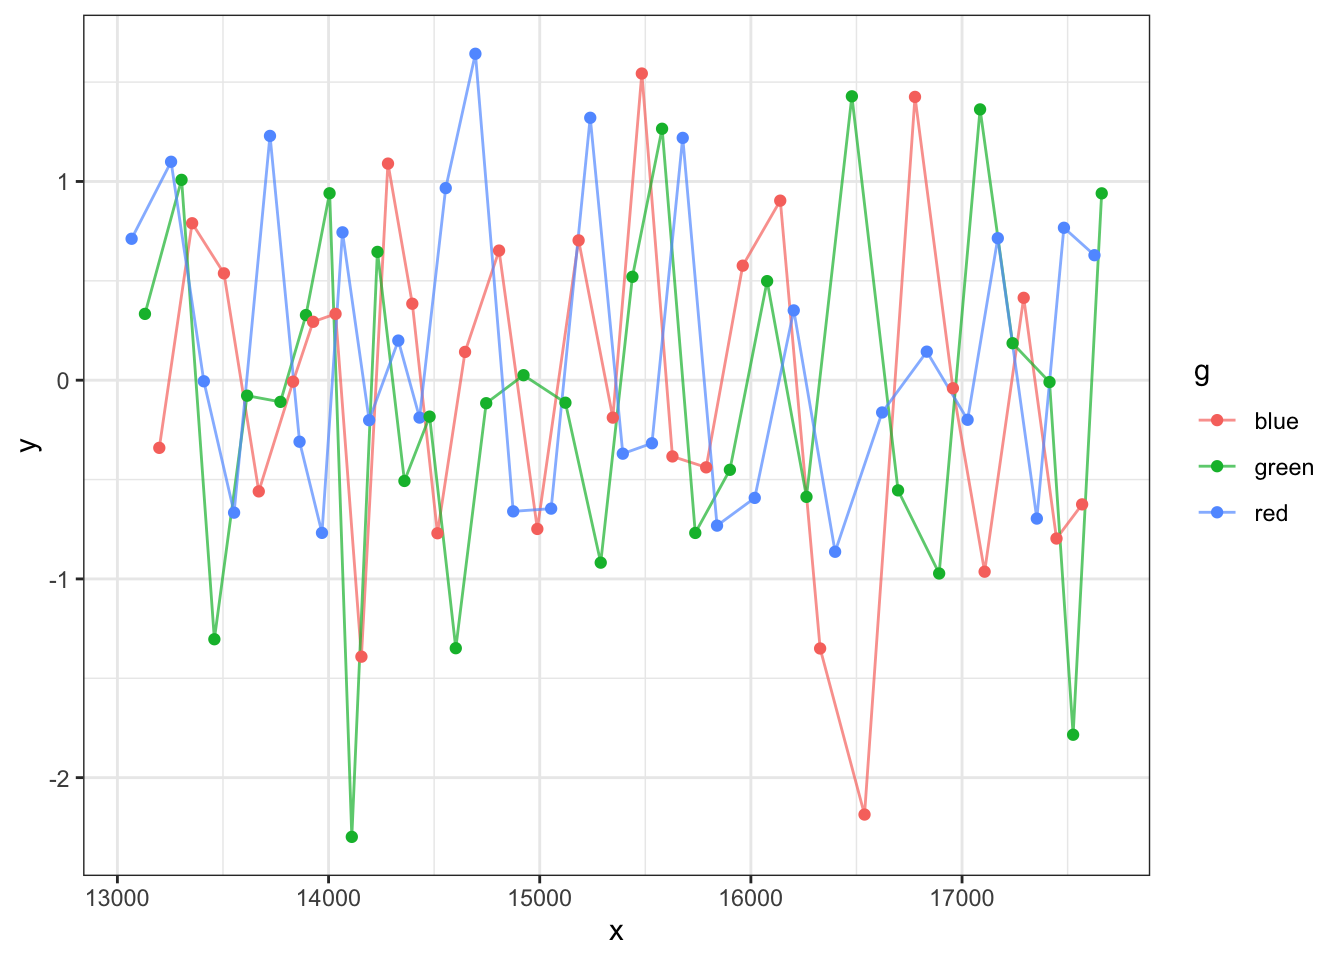
gganimate) provides some new features for animation in R. Its big advantage is it could make use of ggplot API and embeded into ggplot. Next, I will use a sample data to show the example. Then I will use some real educational data to explore a little bit what we can do in psychometric area.
1 A Simple Example
I want to introduce this package.
1.1 1.0 Load the packages requried
1.2 1.1 prepare the data
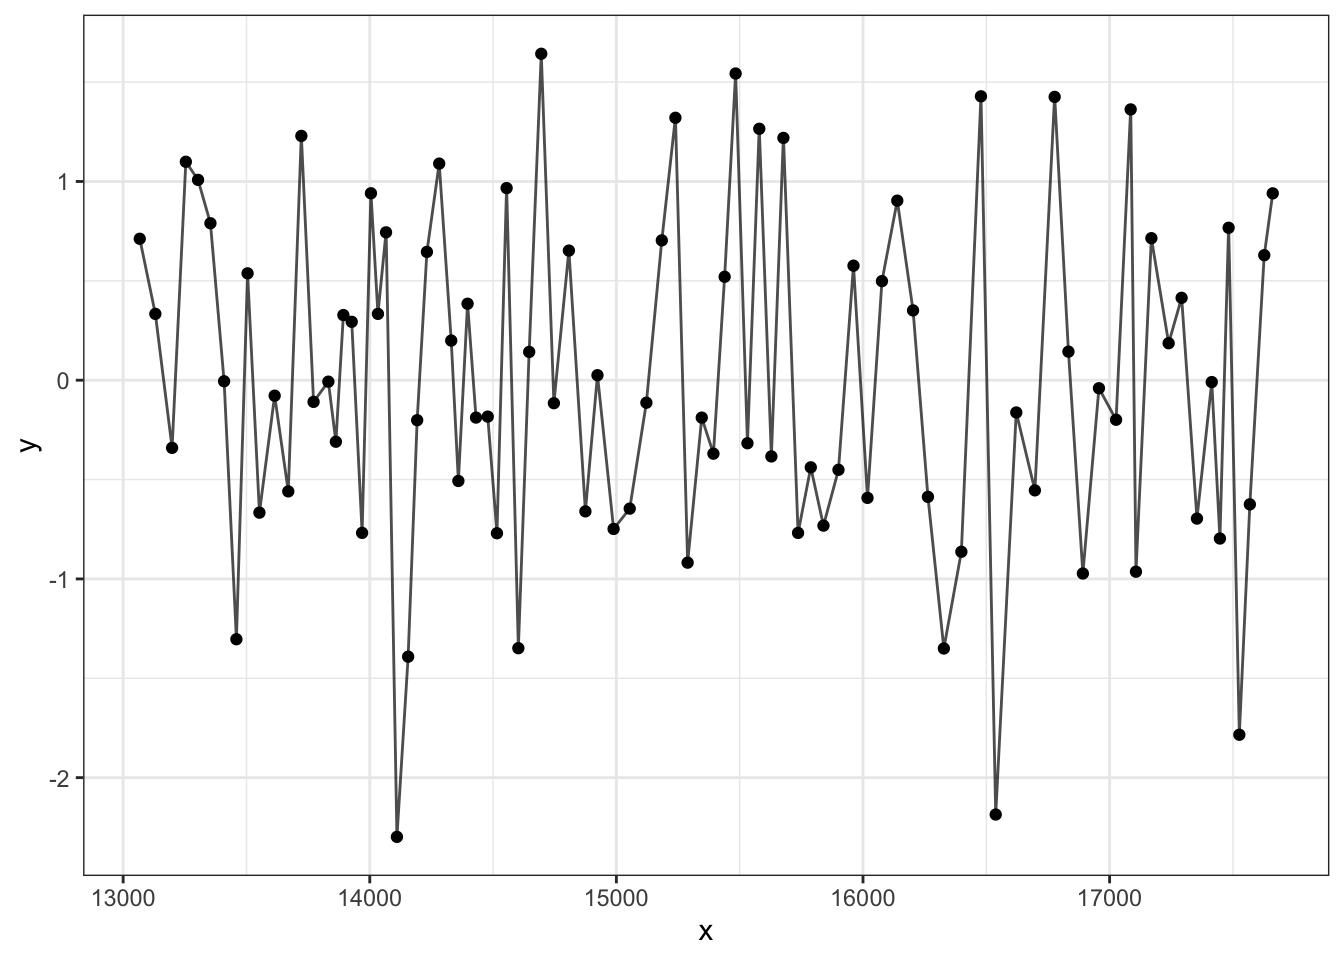
1.2.1 transition_reveal: gradually reveal the data
⌘+C