Loading required package: pacmanShinyapp: Scoring and Reliability Analysis of Psychometric Network
Minimal Example
⌘+C
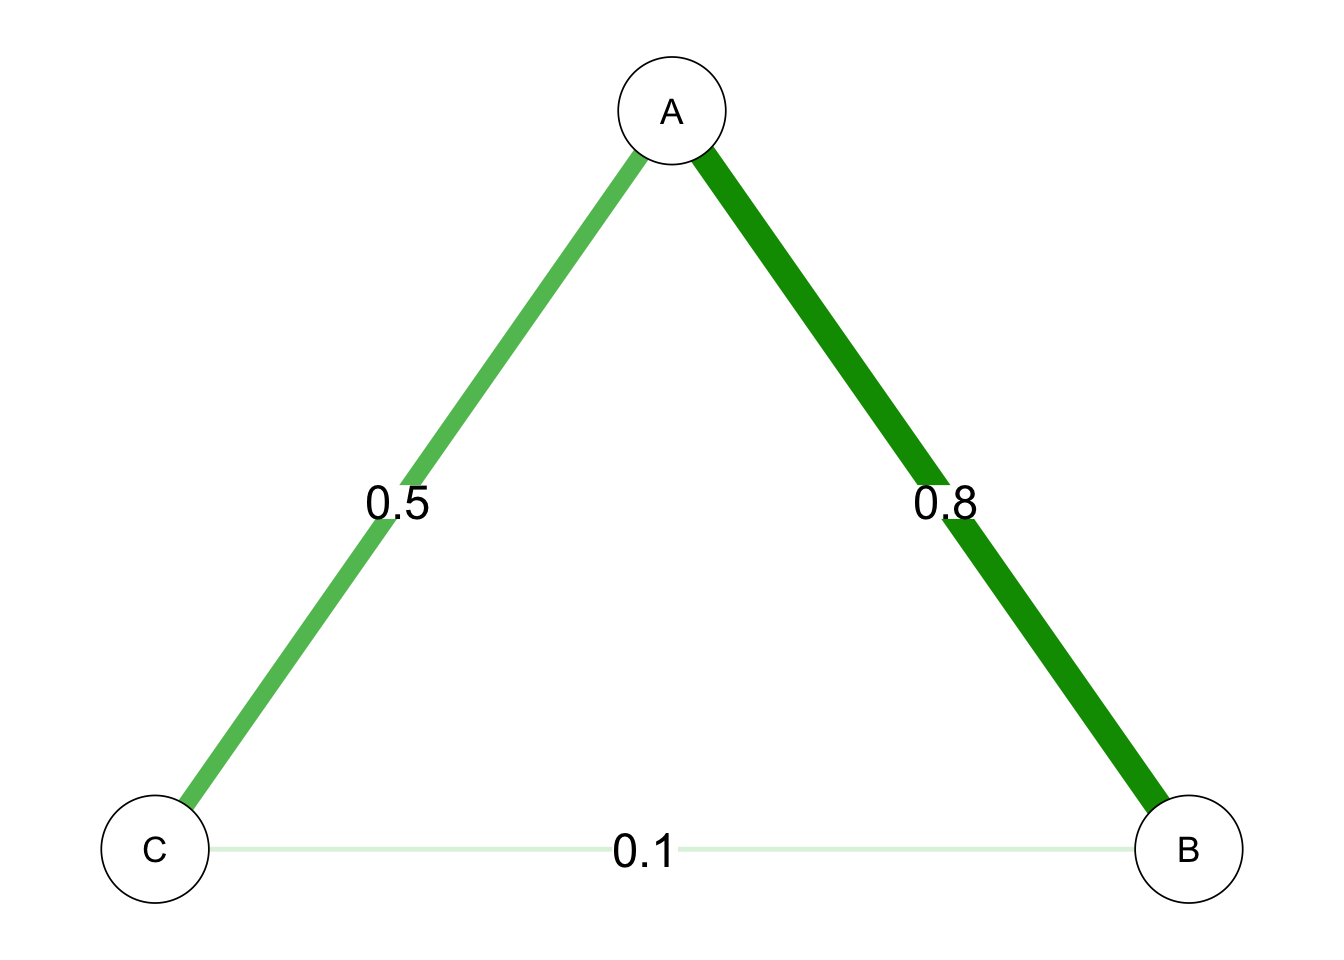
The centrality measures for three nodes:
| node | Betweenness | Closeness | Strength | ExpectedInfluence |
|---|---|---|---|---|
| A | 1.155 | 1.114 | 1.044 | 1.044 |
| B | -0.577 | -0.295 | -0.095 | -0.095 |
| C | -0.577 | -0.819 | -0.949 | -0.949 |
Assume that there are two individuals with different scores on three items:
⌘+C
| A | B | C | |
|---|---|---|---|
| Person1 | 1 | 1 | 5 |
| Person2 | 5 | 1 | 1 |
We can calculate the weighted network scores for them based on Strength centrality measures and their item scores
The strength-based network score reflect one’s overall level of clusters of nodes in a network.