This simulation study is to show how to do IRT Linking Process using mirt R Package. The simulation data includes 2 forms - Form A and Form B. These 2 forms are simulated based on 2 groups of individual, one group has 0 mean trait, another has 0.25 mean trait. Both groups have same sd.
2 Introduction
The means and sds of simulated Form A and B are like:
The mean of \theta for individuals administrated with form A is 0, the standard deviation (SD=1). In the dataset, X is ID, V1 is true trait (\theta), V3 to V52 is unique items, V54 to V63 are common items.
3.1 Look at the data
First of all, have a look at the data
R Code
library(mirt)library(tidyverse)
Warning: package 'dplyr' was built under R version 4.2.3
Warning: package 'stringr' was built under R version 4.2.3
R Code
library(knitr)### Read in Raw data from Form A:dat <-read.csv(file="FormA.csv")glimpse(dat)
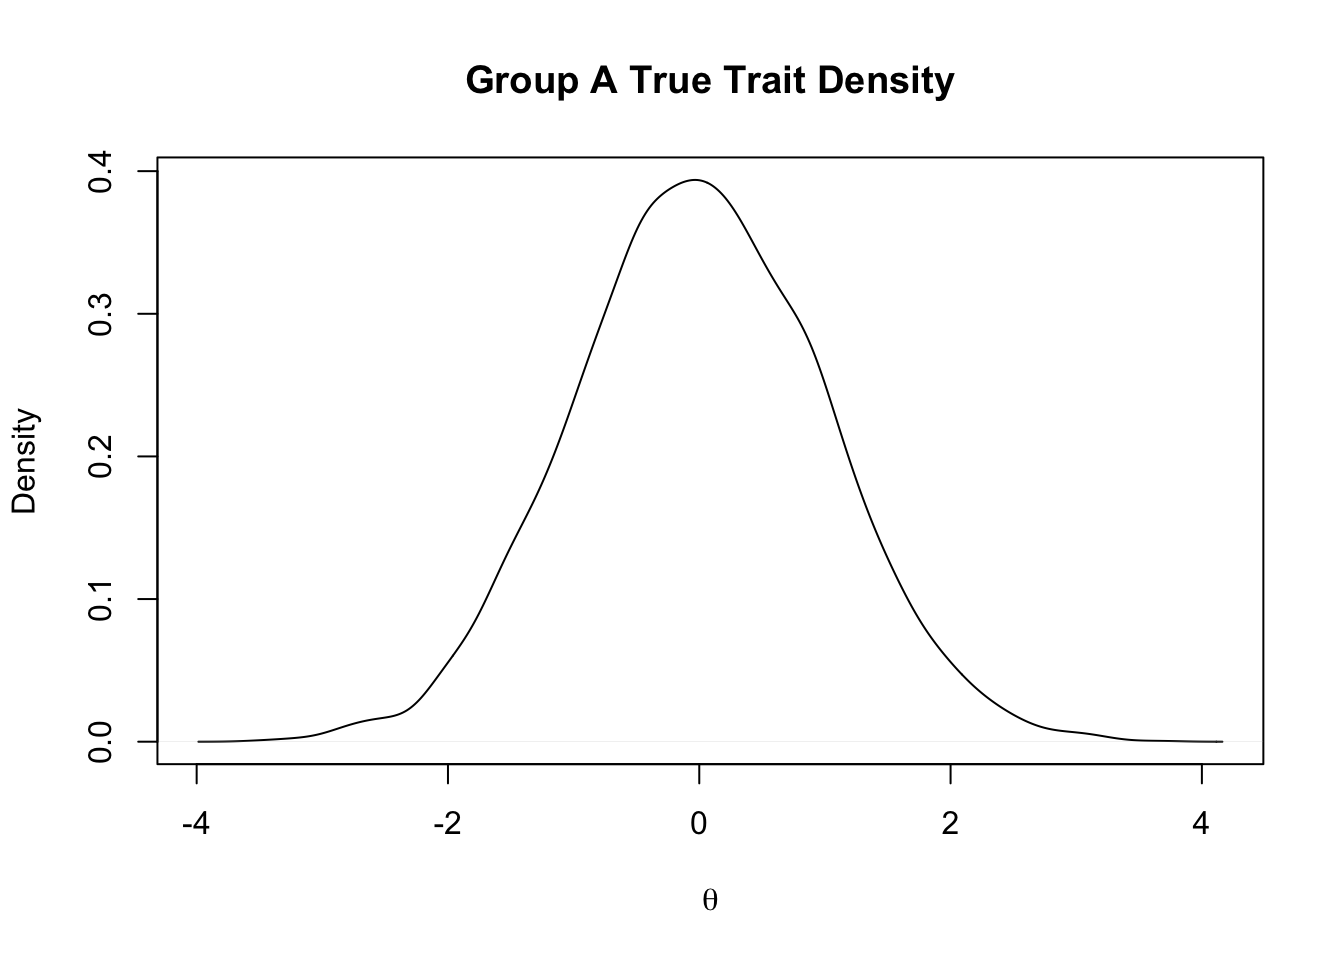
From the density function, mu_{\theta} is 0, sd_{\theta} is 1.
R Code
plot(density(dat$V1), main ="Group A True Trait Density", xlab=expression(theta) )
3.3 CTT Table
CTT table could provide a brief description of table. 2 key valables in the table is item difficulty (item.diff) calculated by item means P(y=1) and item discrimination (item.disc), which is item-total correlation.
3.3.1 Clean data
By cleaning, data has 60 items including 50 unique item (from item1 to item50) and 10 common items (from item51 to item60). The sample size is 5000.
R Code
dat_cali <- dat %>%select(V3:V52, V54:V63)colnames(dat_cali) <-paste0("item",1:60)N <-nrow(dat_cali)n <-ncol(dat_cali)
3.3.2 Classical Test Theory
Then calculate the CTT table for Form A. The item discrimination and difficulty could be compared between Form A and Form B. Because the relationship between trait and total score is non-linear, so there is effect of shrinkage.
The relationship between b parameters of A and B reflect the latent traits of A and B:
\theta_{A} = \theta_{B} - 0.25 \\
\sigma_A^2 = \sigma_B^2
thus, b_B -b_A should also be -0.25. the estimated difference of b is calculate by the mean of b parametes of Form A’s common items and that of Form B’s common items, which is -0.2756443. Thus, it is very close to difference of true traits.
# mean(a_A[51:60]) / mean(a_B[51:60]) #SDs of b-values across formsSD_bA <-sd(b_A[51:60])SD_bB <-sd(b_B[51:60])Mean_bA <-mean(b_A[51:60])Mean_bB <-mean(b_B[51:60])
5 Linking
R Code
###### Run one or the other, NOT BOTH!###### MS linking: place item parameters from### Form B on the scale of Form Aslope <- SD_bA / SD_bBinter <- Mean_bA - slope*Mean_bB### MM linking: place item parameters from### Form B on the scale of Form A# slope <- Mean_aA / Mean_aB# inter <- Mean_bA - slope*Mean_bB###### Perform the Linking###LINKED_items <-matrix(0,50,3)#Column 3 is c, it stays the sameLINKED_items[,3] <- c_B[1:50]#Column 2 is b, it is linked:LINKED_items[,2] <- b_B[1:50]*slope + inter#Column 1 is a, it is also linked:LINKED_items[,1] <- a_B[1:50] / slope### Now the ITEM BANK has 110 items all### linked to a common metric!rownames(LINKED_items) <-paste0("item_B", 1:50)ITEM.BANK <-rbind(parms_a[,-4], LINKED_items)# write.csv(ITEM.BANK,file="item_bank.csv")#Link the theta estimatesLINKED_theta <- theta_B[,1]*slope + interLINKED_se <- theta_B[,2]/slope# write.csv(cbind(LINKED_theta,LINKED_se),file="LINKED_FormB_theta_est.csv")paste0("Mean of Theta of B is ",mean(theta_B[,1]) %>%round(3))
[1] "Mean of Theta of B is -0.013"
R Code
paste0("SD of Theta of B is ", sd(theta_B[,1]) %>%round(3))
[1] "SD of Theta of B is 0.97"
R Code
# after Linkedprint("After Linking:")
[1] "After Linking:"
R Code
paste0("Mean of Theta of B is ",mean(LINKED_theta) %>%round(3))
[1] "Mean of Theta of B is 0.269"
R Code
paste0("SD of Theta of B is ",sd(LINKED_theta) %>%round(3))
[1] "SD of Theta of B is 0.935"
R Code
# Theta of A ispaste0("Mean of Theta of A is ",mean(theta_A[,1]) %>%round(3))
[1] "Mean of Theta of A is -0.021"
R Code
paste0("SD of Theta of A is ", sd(theta_A[,1]) %>%round(3))
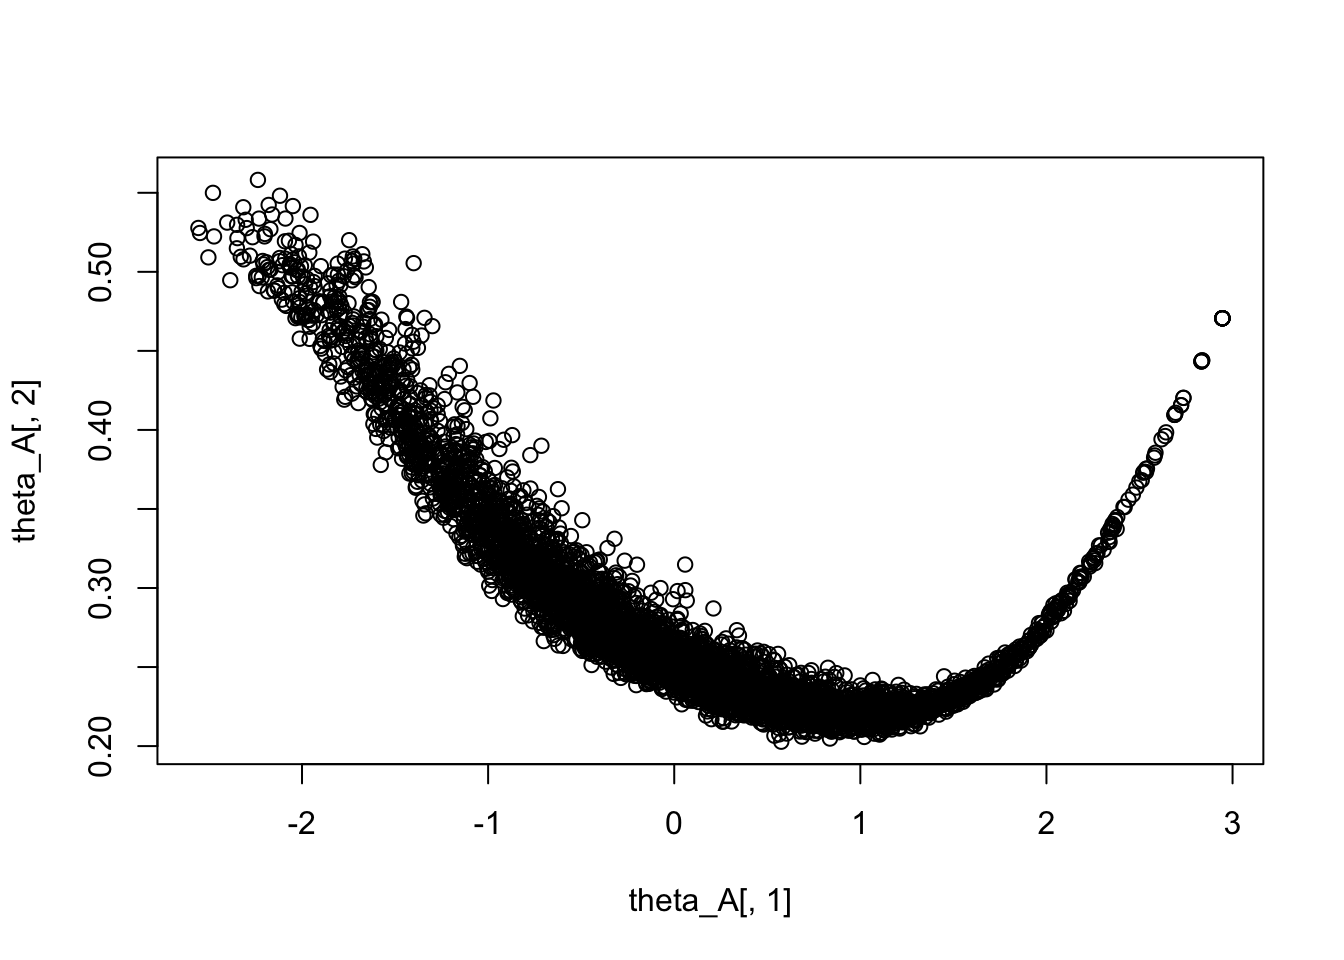
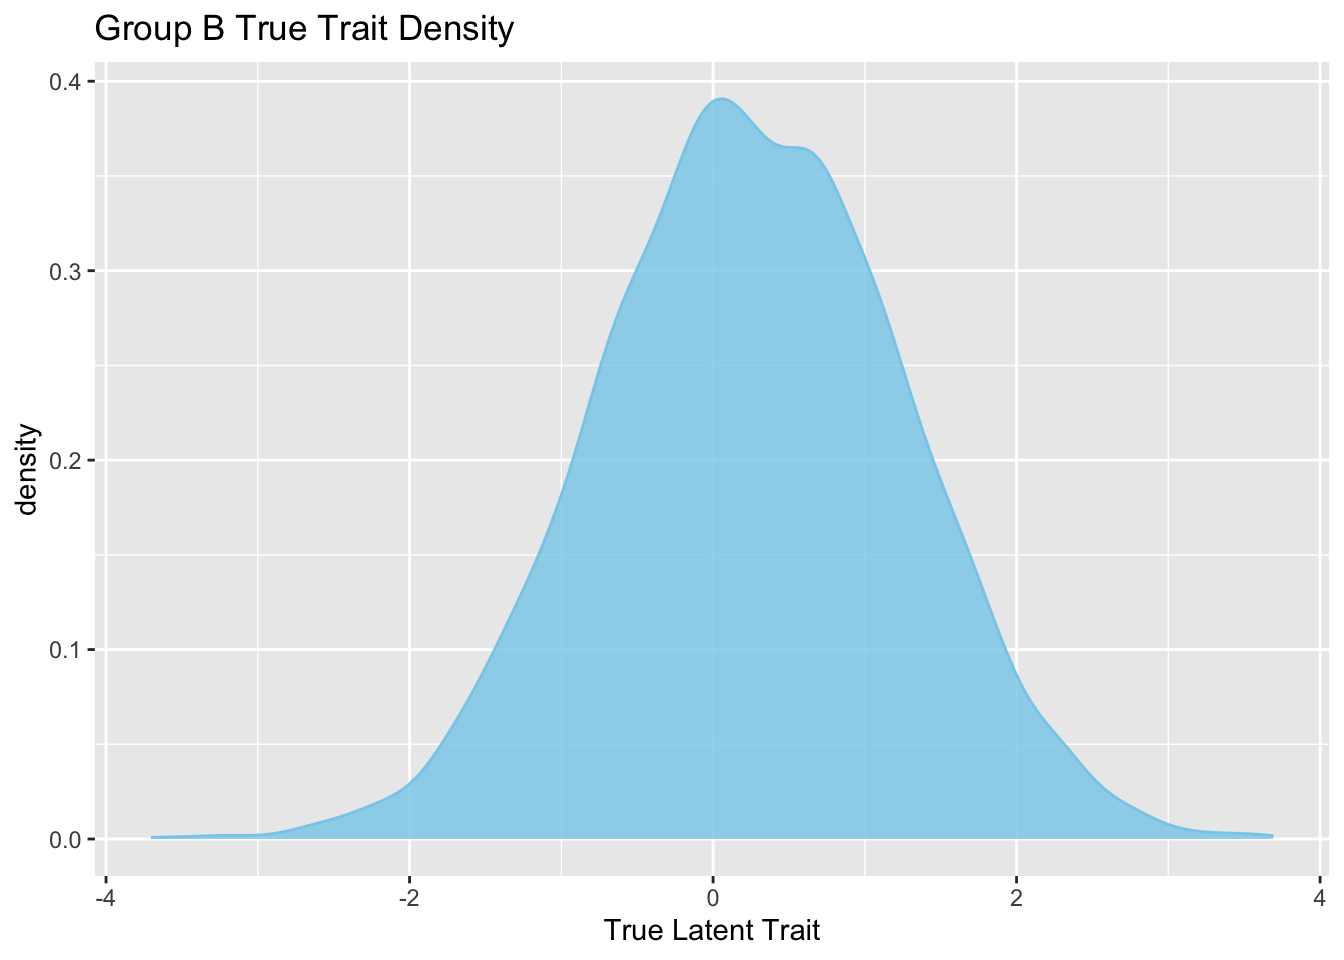
---title: Simulation Study of Linking Using Mirtauthor: Jihong Zhangdate: '2017-11-10'categories: - R - mirt - linkingformat: html: toc: true code-fold: true code-summary: ' R Code' code-line-numbers: true number-sections: true number-offset: 1---```{r setup, include=FALSE}root_dir = here::here("posts", "2017-11-10-Linking-simulation")knitr::opts_chunk$set(echo = TRUE)knitr::opts_knit$set(root.dir = root_dir)```> This simulation study is to show how to do IRT Linking Process using mirt R Package. The simulation data includes 2 forms - Form A and Form B. These 2 forms are simulated based on 2 groups of individual, one group has 0 mean trait, another has 0.25 mean trait. Both groups have same sd. <!--more--># IntroductionThe means and sds of simulated Form A and B are like:$$\theta_{A} = \theta_{B} - 0.25 \\\sigma_A^2 = \sigma_B^2$$# Calibration of Form AThe mean of $\theta$ for individuals administrated with form A is 0, the standard deviation (SD=1). In the dataset, X is ID, V1 is true trait ($\theta$), V3 to V52 is unique items, V54 to V63 are common items.## Look at the dataFirst of all, have a look at the data```{r , message=FALSE}library(mirt)library(tidyverse)library(knitr)### Read in Raw data from Form A:dat <- read.csv(file="FormA.csv")glimpse(dat)```## Plot the density of true $\theta$ of Group AFrom the density function, $mu_{\theta}$ is 0, $sd_{\theta}$ is 1.```{r theta}plot(density(dat$V1), main = "Group A True Trait Density", xlab=expression(theta) )```## CTT TableCTT table could provide a brief description of table. 2 key valables in the table is item difficulty (*item.diff*) calculated by item means $P(y=1)$ and item discrimination (item.disc), which is item-total correlation.### Clean dataBy cleaning, data has 60 items including 50 unique item (from item1 to item50) and 10 common items (from item51 to item60). The sample size is 5000.```{r}dat_cali <- dat %>%select(V3:V52, V54:V63)colnames(dat_cali) <-paste0("item",1:60)N <-nrow(dat_cali)n <-ncol(dat_cali)```### Classical Test TheoryThen calculate the CTT table for Form A. The item discrimination and difficulty could be compared between Form A and Form B. Because the relationship between trait and total score is non-linear, so there is effect of shrinkage.```{r}# item stats## item discrimnationitem.disc <-apply(dat_cali, 2, function(x) cor(x, rowSums(dat_cali, na.rm =TRUE)))## item difficultyitem.diff <-colMeans(dat_cali)## item response frequencyitem.freq <-reduce(lapply(dat_cali, table), bind_rows)CTT <-cbind(item.disc, item.diff, item.freq)kable(CTT, digits =3, caption ="CTT Table for Form A")```## Final Calibration of Form A### Model Specification```{r , message=FALSE, results='hide'}SPECS <- mirt.model('F = 1-60 PRIOR = (1-60, a1, lnorm, 0, 1), (1-60, d, norm, 0, 1), (1-60, g, norm, -1.39,1)')mod_A3PL <- mirt(data=dat_cali, model=SPECS, itemtype='3PL')parms_a <- coef(mod_A3PL, simplify=TRUE, IRTpars = TRUE)$items``````{r , message=FALSE}a_A <- parms_a[,1] b_A <- parms_a[,2] c_A <- parms_a[,3] theta_A <- fscores(mod_A3PL,method="EAP", full.scores=TRUE, full.scores.SE=TRUE, scores.only=TRUE)```Using 3-PL for irt model of form A. Extracting the cofficients (a, b, c) of IRT. The model-implied theta was outputed, whose mean is `r mean(theta_A)`The plot below suggest that SE is low when theta is close to mean, but low theta and high theta has large SE.```{r SE}plot(theta_A[,1],theta_A[,2])```# Calibration of Form BThe structure of Form B is as same as Form A.```{r}dat_b <-read.csv(file="FormB.csv")glimpse(dat_b)``````{r theta_b}library(ggplot2)ggplot(data = dat_b) + ggtitle("Group B True Trait Density") + geom_density(aes(x = V1), fill = "skyblue", col = "skyblue", alpha=0.8) + xlab("True Latent Trait")``````{r stats2}dat_cali2 <- dat_b %>% select(V3:V52, V54:V63)colnames(dat_cali2) <- paste0("item",1:60)N <- nrow(dat_cali2)n <- ncol(dat_cali2)# item stats## item discrimnationitem.disc <- apply(dat_cali2, 2, function(x) cor(x, rowSums(dat_cali, na.rm = TRUE)))## item difficultyitem.diff <- colMeans(dat_cali2)## item response frequencyitem.freq <- reduce(lapply(dat_cali2, table), bind_rows)CTT2 <- cbind(item.disc, item.diff, item.freq)kable(CTT2, digits = 3, caption = "CTT Table for Form A")```## Final Calibration of Form A### Model Specification of B```{r , message=FALSE, results='hide'}SPECS2 <- mirt.model('F = 1-60 PRIOR = (1-60, a1, lnorm, 0, 1), (1-60, d, norm, 0, 1), (1-60, g, norm, -1.39,1)')mod_B3PL <- mirt(data=dat_cali2, model=SPECS, itemtype='3PL')parms_b <- coef(mod_B3PL, simplify=TRUE, IRTpars = TRUE)$items``````{r , message=FALSE}a_B <- parms_b[,1] b_B <- parms_b[,2] c_B <- parms_b[,3] theta_B <- fscores(mod_B3PL,method="EAP", full.scores=TRUE, full.scores.SE=TRUE, scores.only=TRUE)head(theta_B, 20) %>% kable(digits = 3, caption = "Model-implied Theta of B")```## b-plotThe relationship between b parameters of A and B reflect the latent traits of A and B:$$\theta_{A} = \theta_{B} - 0.25 \\\sigma_A^2 = \sigma_B^2$$ thus, $b_B -b_A$ should also be -0.25. the estimated difference of b is calculate by the mean of b parametes of Form A's common items and that of Form B's common items, which is `r mean(b_B[51:60])-mean(b_A[51:60])`. Thus, it is very close to difference of true traits.```{r}### b-plotplot(b_A[51:60],b_B[51:60],main=paste0("r =", round(cor(b_A[51:60],b_B[51:60]),5)), xlab ="b_A",ylab ="b_B" )# mean(b_B[51:60])-mean(b_A[51:60])```## a-plotBecause $\theta_B - \theta_A = 0.25$, so a parametes are: $$a_A / a_B = 1$$The true ratio of (means of) a parameters is 1.016284, which is very close to 1. SD of A and B are both close to 1.```{r}### a-plotplot(a_A[51:60],a_B[51:60],main=round(cor(a_A[51:60],a_B[51:60]),5) )# mean(a_A[51:60]) / mean(a_B[51:60]) #SDs of b-values across formsSD_bA <-sd(b_A[51:60])SD_bB <-sd(b_B[51:60])Mean_bA <-mean(b_A[51:60])Mean_bB <-mean(b_B[51:60])```# Linking```{r}###### Run one or the other, NOT BOTH!###### MS linking: place item parameters from### Form B on the scale of Form Aslope <- SD_bA / SD_bBinter <- Mean_bA - slope*Mean_bB### MM linking: place item parameters from### Form B on the scale of Form A# slope <- Mean_aA / Mean_aB# inter <- Mean_bA - slope*Mean_bB###### Perform the Linking###LINKED_items <-matrix(0,50,3)#Column 3 is c, it stays the sameLINKED_items[,3] <- c_B[1:50]#Column 2 is b, it is linked:LINKED_items[,2] <- b_B[1:50]*slope + inter#Column 1 is a, it is also linked:LINKED_items[,1] <- a_B[1:50] / slope### Now the ITEM BANK has 110 items all### linked to a common metric!rownames(LINKED_items) <-paste0("item_B", 1:50)ITEM.BANK <-rbind(parms_a[,-4], LINKED_items)# write.csv(ITEM.BANK,file="item_bank.csv")#Link the theta estimatesLINKED_theta <- theta_B[,1]*slope + interLINKED_se <- theta_B[,2]/slope# write.csv(cbind(LINKED_theta,LINKED_se),file="LINKED_FormB_theta_est.csv")paste0("Mean of Theta of B is ",mean(theta_B[,1]) %>%round(3))paste0("SD of Theta of B is ", sd(theta_B[,1]) %>%round(3))# after Linkedprint("After Linking:")paste0("Mean of Theta of B is ",mean(LINKED_theta) %>%round(3))paste0("SD of Theta of B is ",sd(LINKED_theta) %>%round(3))# Theta of A ispaste0("Mean of Theta of A is ",mean(theta_A[,1]) %>%round(3))paste0("SD of Theta of A is ", sd(theta_A[,1]) %>%round(3))```