⌘+C
data("austres")
dt <- data.frame(x=as.matrix(austres), date=time(austres))
dt$y <- rnorm(nrow(dt))
dt$date <- as.numeric(dt$date)A new R packge (
gganimate) provides some new features for animation in R. Its big advantage is it could make use of ggplot API and embeded into ggplot. Next, I will use a sample data to show the example. Then I will use some real educational data to explore a little bit what we can do in psychometric area.
I want to introduce this package.
data("austres")
dt <- data.frame(x=as.matrix(austres), date=time(austres))
dt$y <- rnorm(nrow(dt))
dt$date <- as.numeric(dt$date)p <- ggplot(dt,
aes(y = y, x =x)) +
geom_line(alpha = 0.7) +
geom_point()
p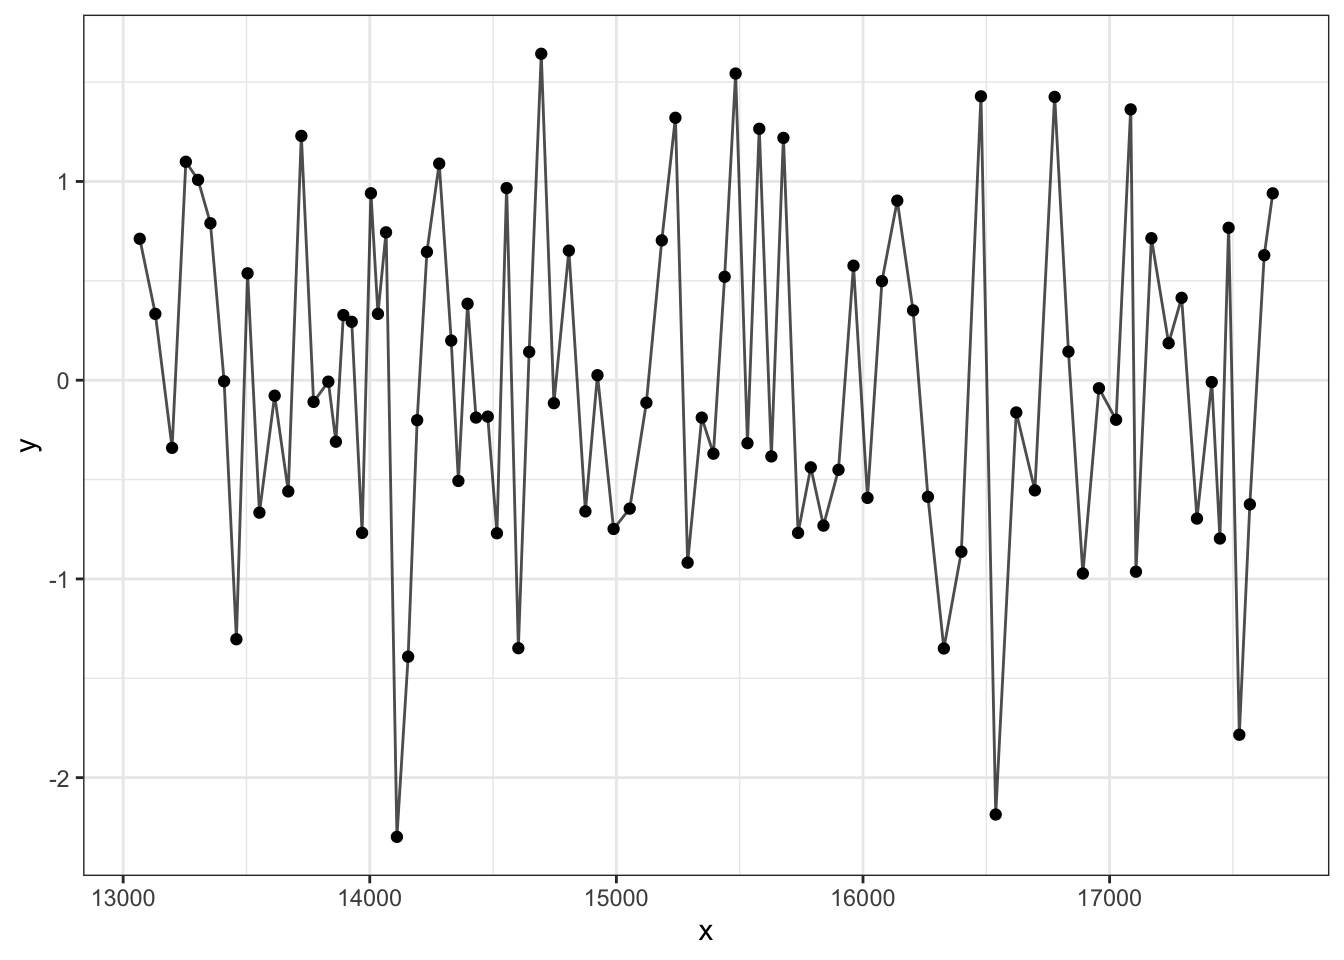
transition_reveal: gradually reveal the datap + transition_reveal(date)
dt$g <- rep( c("red", "green", "blue"), length.out = nrow(dt))p_bygroup <- ggplot(dt,
aes(y = y, x =x, col = g)) +
geom_line(alpha = 0.7) +
geom_point()
p_bygroup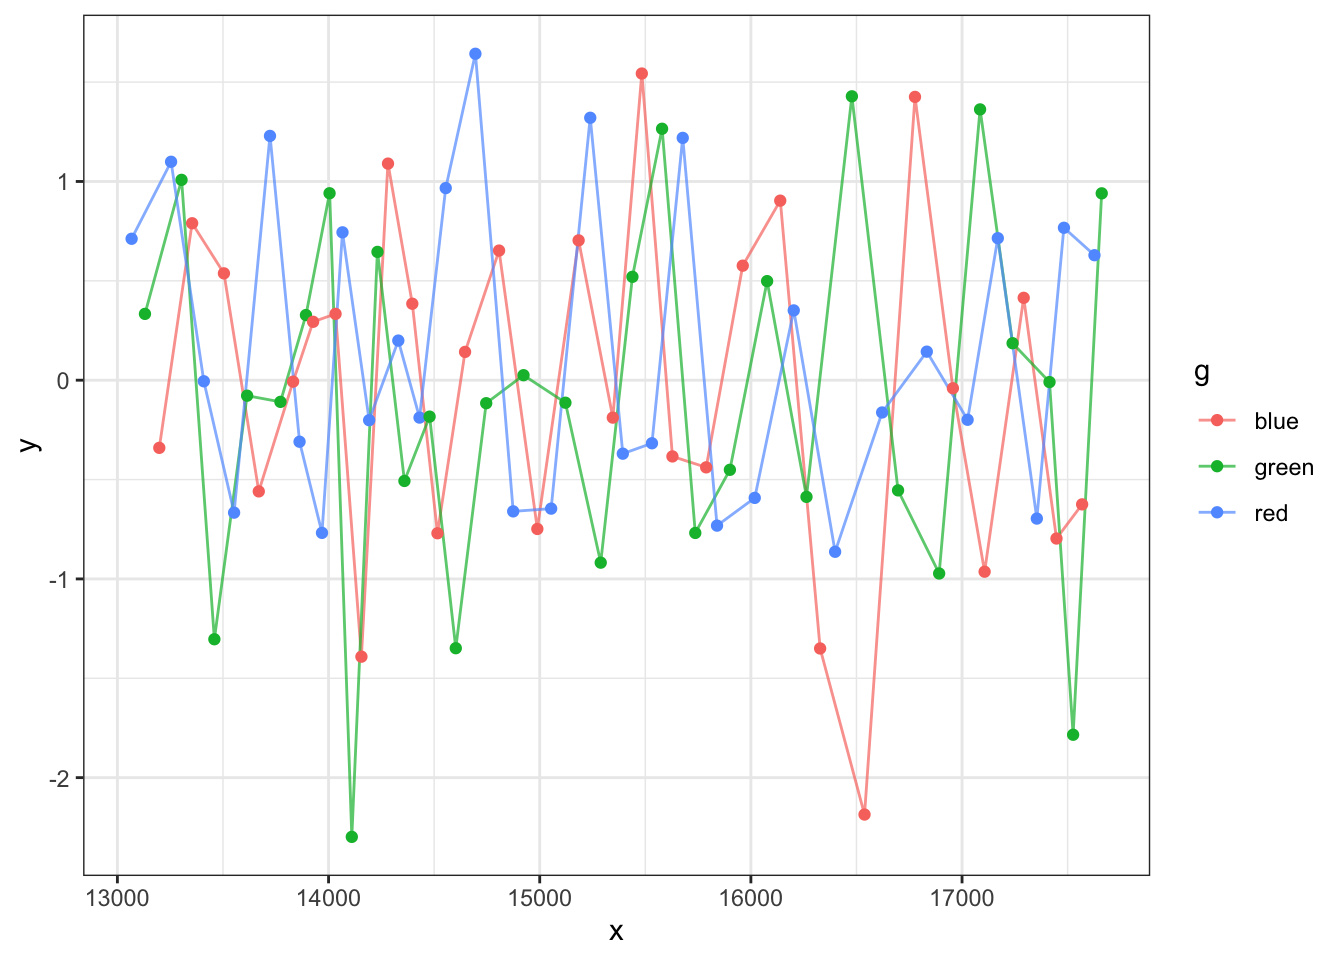
p_bygroup + transition_reveal(date)