⌘+C
library(XML)
library(stringr)
library(rvest)
library(tidyverse)
library(kableExtra)This is an example of how to web scrape grants of active research in college’s official website. Please follow the academia institute’s website robots rules.
library(XML)
library(stringr)
library(rvest)
library(tidyverse)
library(kableExtra)topics = rep(NA, 84)
fundings = rep(NA, 84)
iter = 0
for (page in 1:9) {
## parent webpage
scrape_url <- paste0('http://XXXXXXXXXXXXXXXXXXXXXX', page)
html_form_page <- read_html(scrape_url)
## find the child web page containing projects' name, total award, topic etc.
child_url = html_form_page |> html_elements("h3 a[href]") |> html_attr("href")
for (item in 1:length(child_url)) {
iter = iter + 1
child_html_text <- child_url[item] |> read_html() |> html_elements("div[class='study_wrapper']") |> html_text()
topic = child_html_text |> str_extract(pattern = "Topic\\(s\\)\\: [a-zA-Z]+\\b") |> str_replace(pattern = "Topic\\(s\\)\\: ", "")
funding = child_html_text |> str_extract(pattern = "\\$\\d+\\,\\d+") |> str_replace_all(pattern = "\\$|\\,", "") |> as.numeric()
topics[iter] = topic
fundings[iter] = funding
}
}
dat <- data.frame(topic = topics, funding_amount = fundings) |>
add_row(topic = "Marijuana", funding_amount = 3743) |>
mutate(topic = ifelse(topic == "TobaccoMarijuana", "Tobacco", topic)) | topic | funding_amount |
|---|---|
| Other | 97666 |
| Other | 15000 |
| Tobacco | 1271 |
| Cancer | NA |
| Other | 199836 |
| Other | 64614 |
| Cancer | 200000 |
| Other | 75000 |
| Other | 72972 |
| Cancer | 329234 |
## funding per project
dat1 <- dat |>
  group_by(topic) |>
  summarise(funding_amount_mean = mean(funding_amount, na.rm = T)) |>
  mutate(topic = fct_reorder(topic, desc(funding_amount_mean)))

ggplot(dat1) +
  aes(x = topic, y = funding_amount_mean) +
  geom_col(fill = "darkblue") +
  scale_y_continuous(labels = scales::unit_format(unit = "M", scale = 1e-6)) +
  labs(y = "funding per project", title = "Funding for each project during 2019 to 2022") +
  theme(legend.position = "none", text = element_text(size = 12)) # remove lengend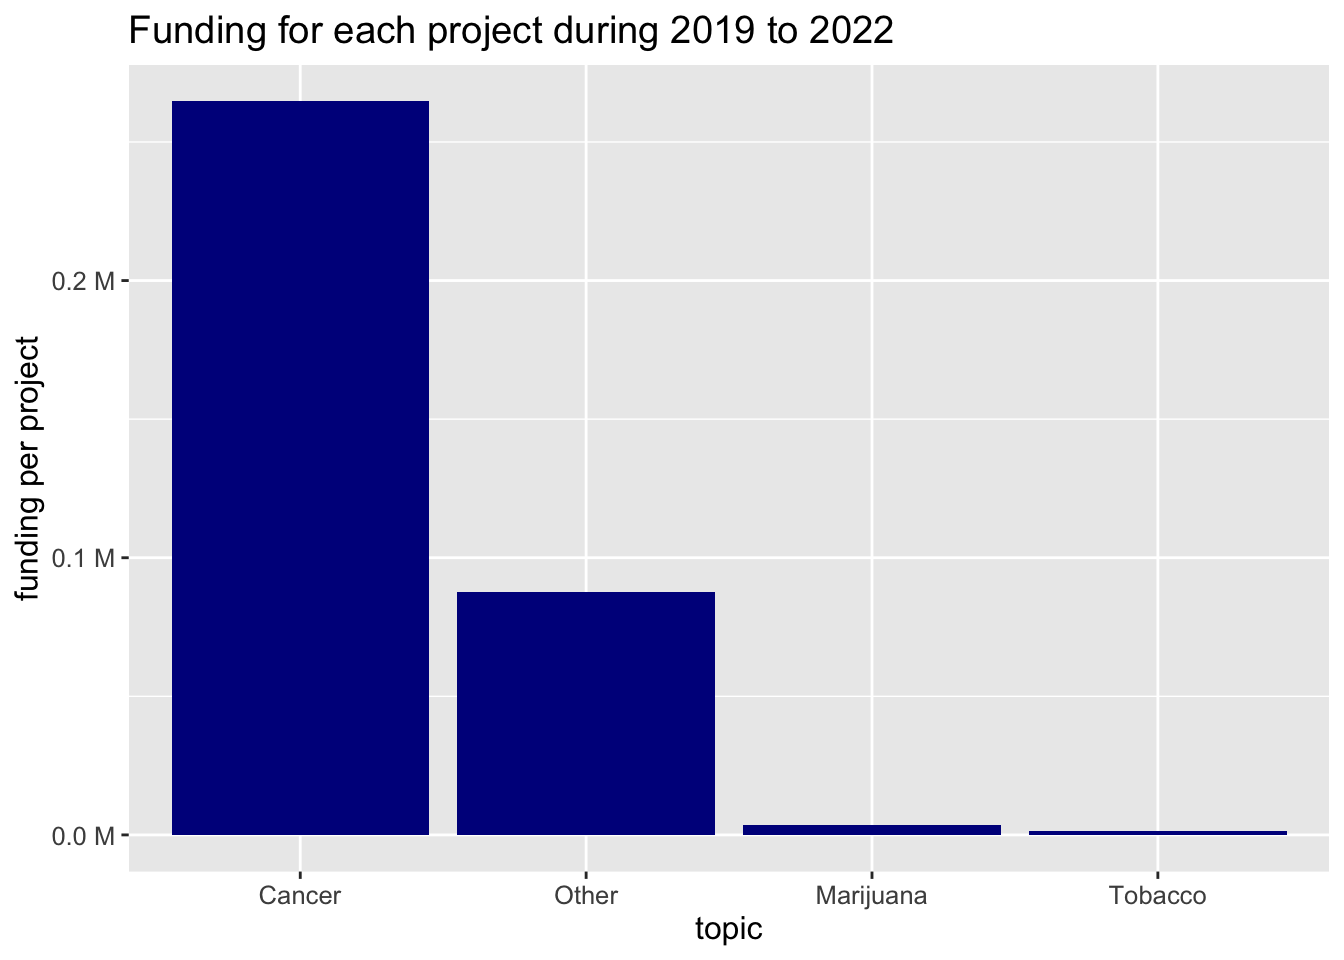
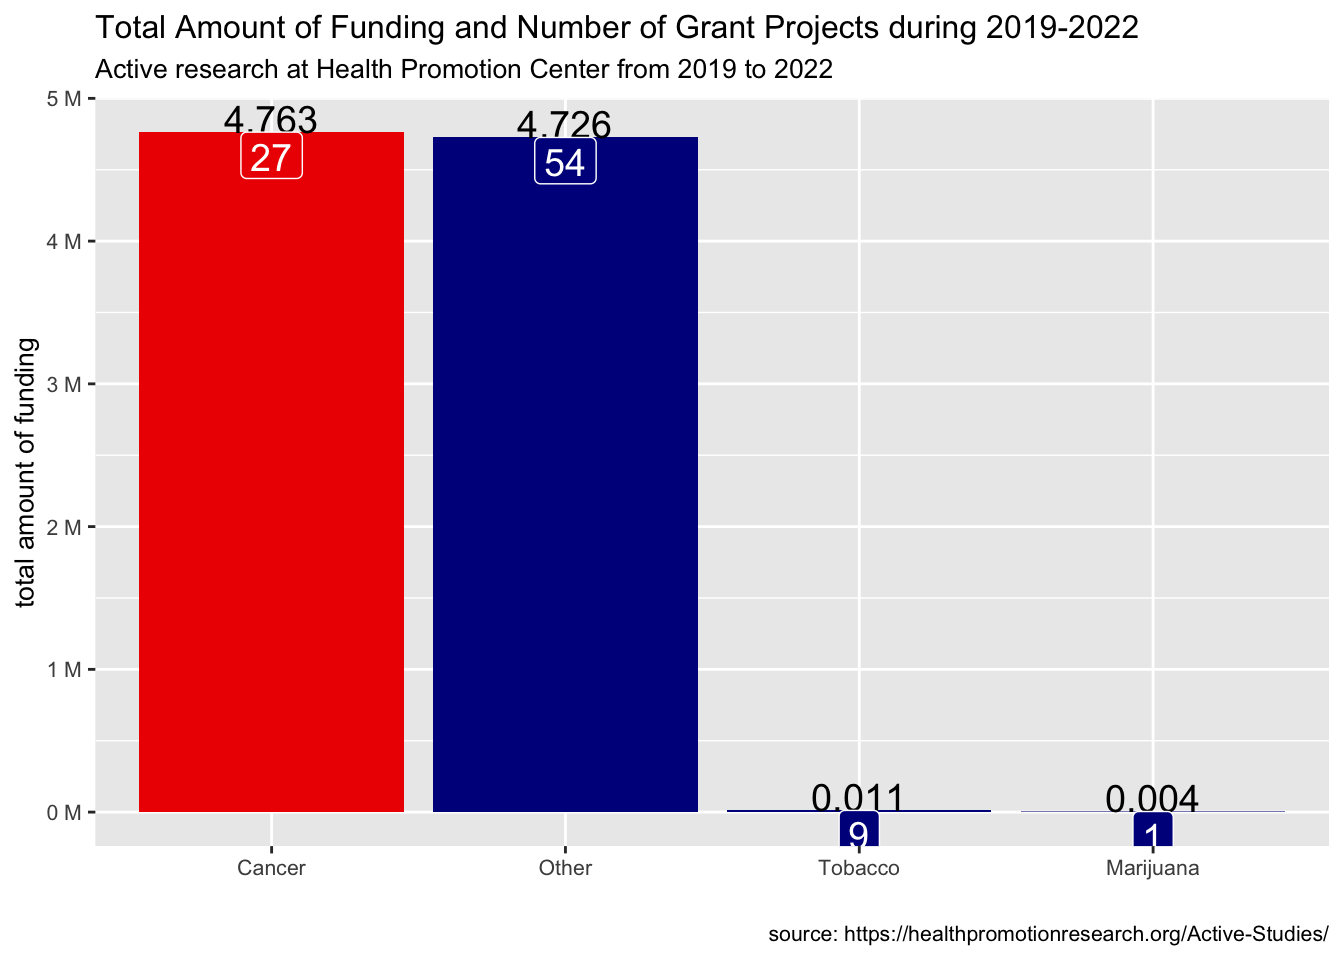
## Total funding amount
dat2 <- dat |>
  group_by(topic) |>
  summarise(
    funding_amount_sum = sum(funding_amount, na.rm = T),
    n = n()) |>
  mutate(
    topic = fct_reorder(topic, desc(funding_amount_sum)),
    highlight = ifelse(funding_amount_sum == max(funding_amount_sum), 1, 0) |> as.factor())

ggplot(dat2) +
  aes(x = topic, y = funding_amount_sum, fill = highlight) +
  geom_col() +
  geom_text(aes(label = round(funding_amount_sum/ 10^6, 3)), vjust = 0.001, size = 5) +
  geom_label(aes(label = n), vjust = 0.999, size = 5, color = "white") +
  scale_fill_manual(values = c("darkblue", "red2")) +
  labs(x = "", y = "total amount of funding",
       title = "Total Amount of Funding and Number of Grant Projects during 2019-2022",
       subtitle = "Active research at Health Promotion Center from 2019 to 2022",
       caption = "source: https://healthpromotionresearch.org/Active-Studies/") +
  scale_y_continuous(labels = scales::unit_format(unit = "M", scale = 1e-6)) +
  theme(legend.position = "none", text = element_text(size = 10)) # remove lengend