⌘+C
if(!require(MplusAutomation)) install.packages("MplusAutomation")
library(tidyverse)
library(purrr) # for map functions
library(furrr) # for parallel mapMplus is a very popular program for varied latent varaible modeling: (1) Structural equation modeling (2) multilevel analysis (3) mixture modeling (latent class model). R, in the other hand, is a general statistical programming language which not limits to certain statistical models. However, there are scarcely online resources illustrate how to run Mplus using R on Mac.
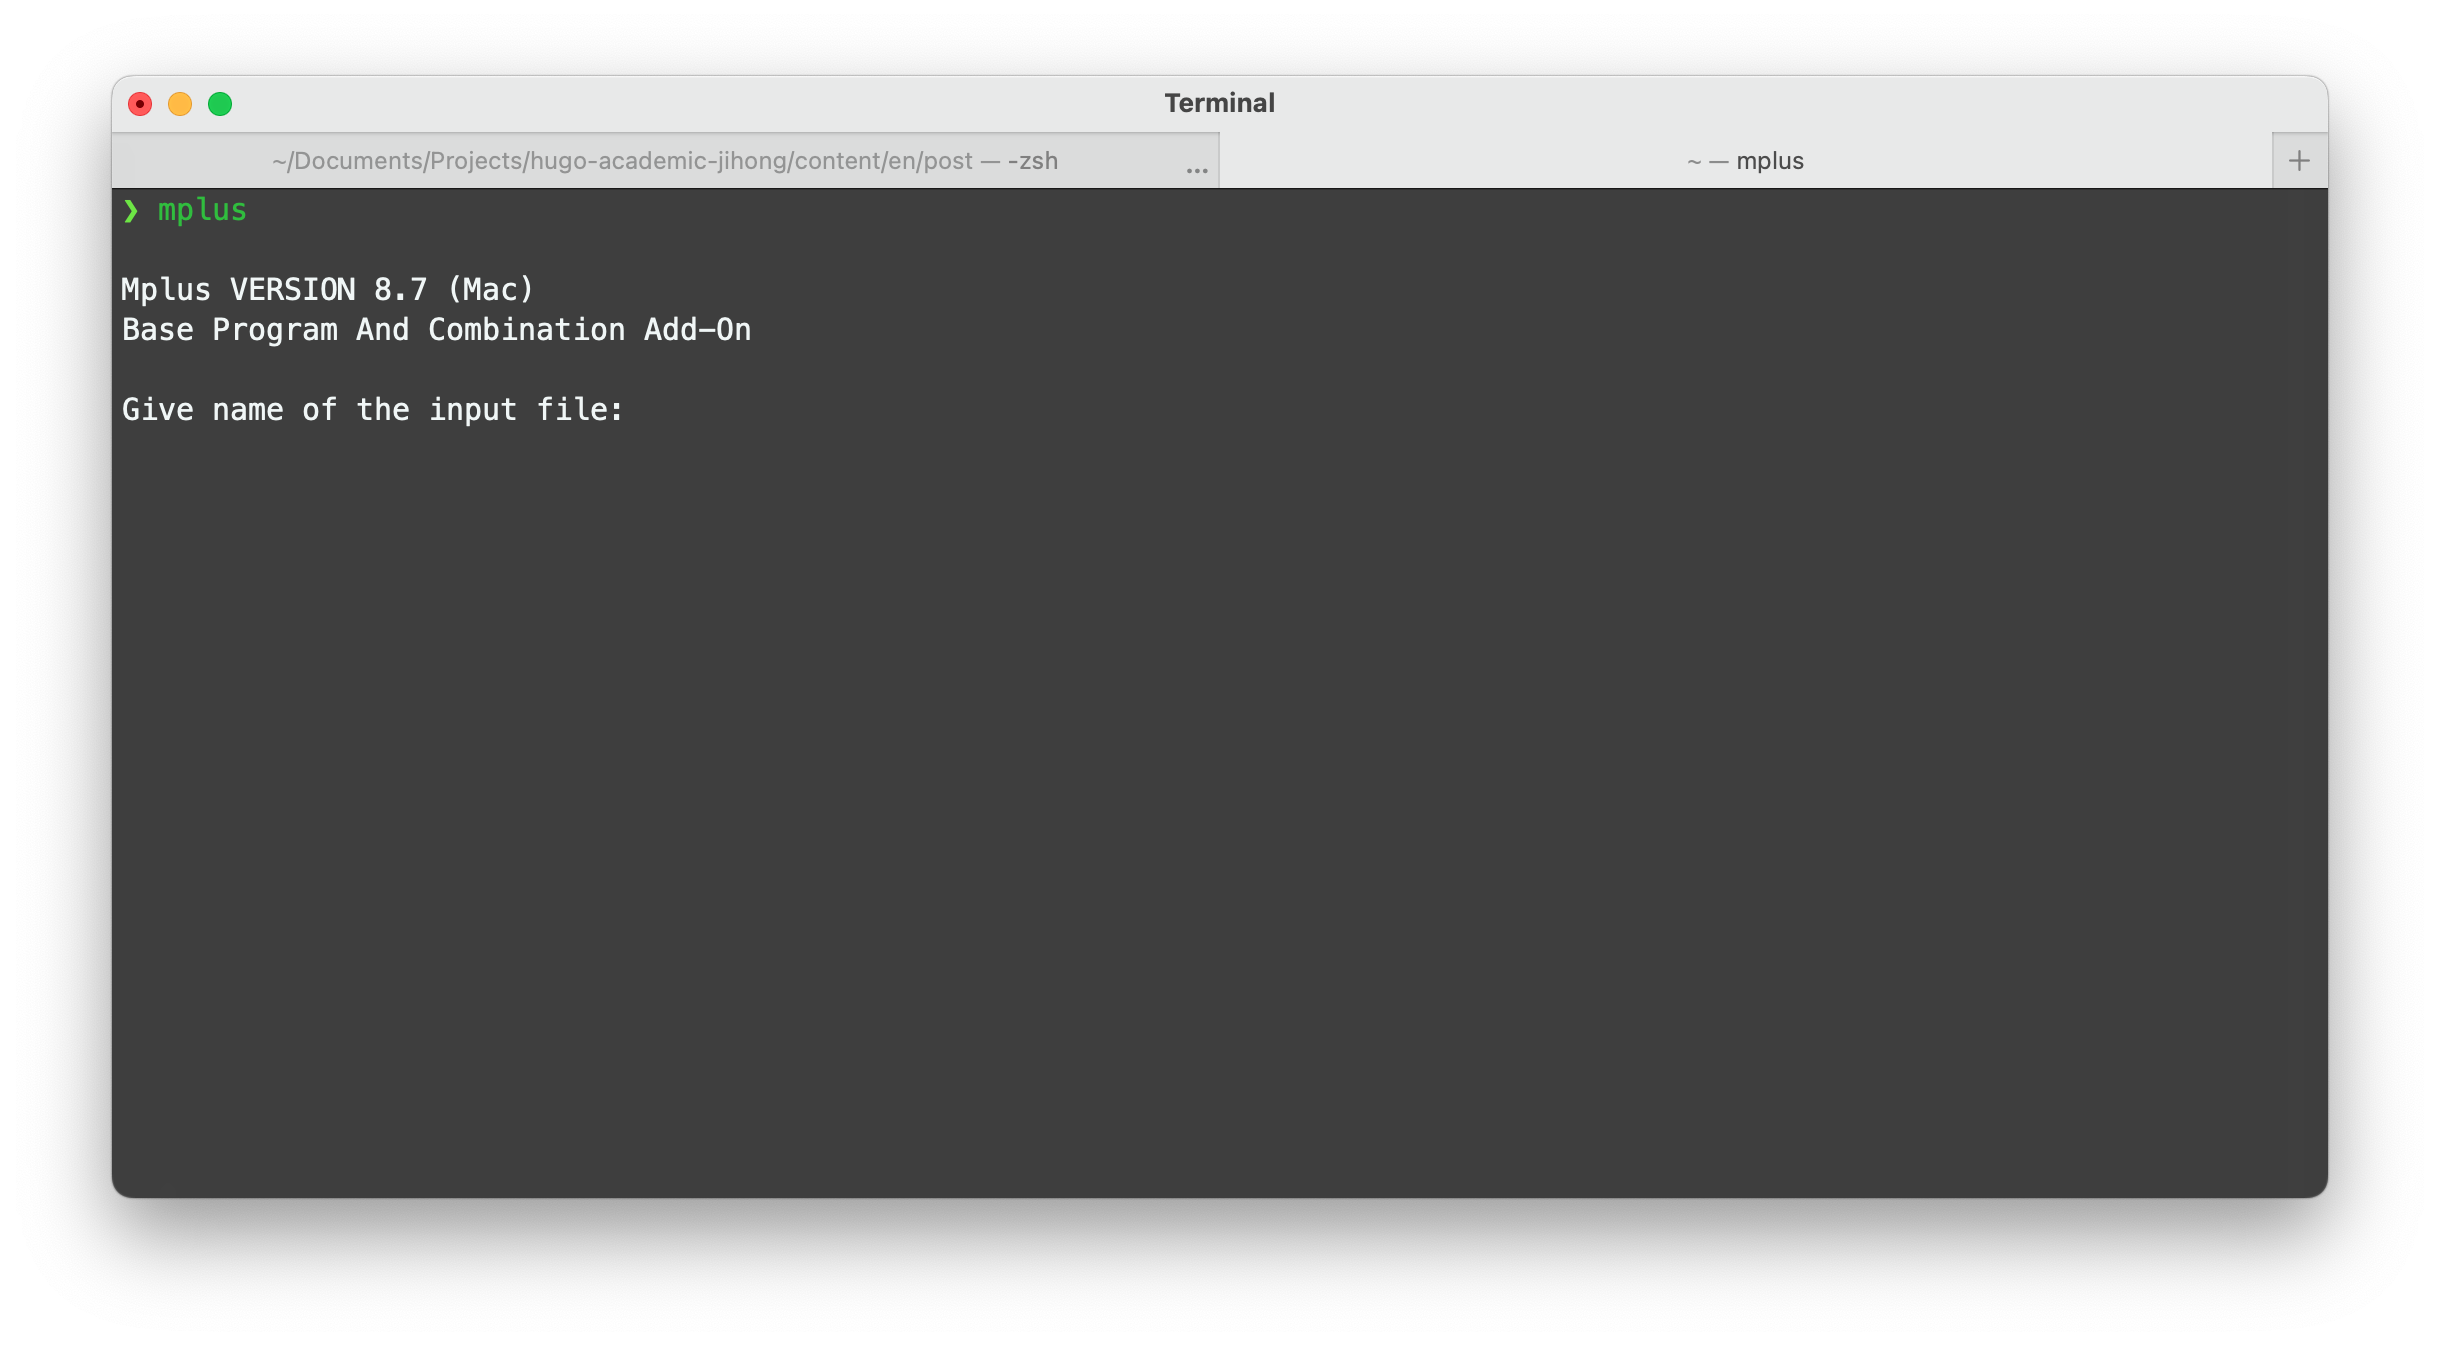
To make sure Mplus can been successfully called in R, the very first thing is checking whether your MacOS can use command-line version of Mplus. Simply type Mplus command in your terminal app on Mac, if you see “Mplus VERSION (Mac)”, then Mplus on MacOS should work and can be called within R. Otherwise, you should check whether you install Mplus software successfully beforehand.
Second, you should install R + Rstudio (Optional). Rstudio is optional but strongly recommended.
Third, MplusAutomation package should also been installed in R:
if(!require(MplusAutomation)) install.packages("MplusAutomation")
library(tidyverse)
library(purrr) # for map functions
library(furrr) # for parallel mapIf everything looks good, we are ready to go.
A vanilla Mplus input file for latent class model look like followings:
TITLE:
Batch Analysis of Latent Class Models;
DATA:
FILE = "Code/Mplus/datFile.dat";

VARIABLE:
NAMES = Male Age Chinese EduF_Med EduF_High EduM_Med EduM_High EduS_Med EduS_High YM
     HY SD PSD YASB YRCS YO YCR SEN Subgroup CE1 SC1 SI1 YCDC1 CLDH1;
 MISSING=.;

      CATEGORICAL = Male-SEN;
      CLASSES = c(10);
      AUXILIARY = CE1-CLDH1 (R3STEP);

ANALYSIS:

      TYPE = MIXTURE;

OUTPUT:
TECH1 TECH8 TECH11;
SAVEDATA:

      FILE IS model1_savedata.txt;
      SAVE IS cprob;
      FORMAT IS free;
It looks very cumbersome to write one by one line by hand. For example, VARIABLE > NAMES in Mplus input file contains all indicators and auxiliary variables used for latent class modeling. Any typos may give rise to Mplus throwing out error messages in the estimation.
Thankfully, there’s no need to write the Mplus syntax manually in text editor. Instead, you can write R code to automatically compile Mplus input files for you. In the following sections, I will illustrate how to do that using a real example.
The example makes use of a data set including nine variables of demographic variables of youth, such as gender, age, ethnicity, education levels for father, mother and self etc. The goal is to cluster youth into multiple latent classes based on their demographic characteristics.
dat <- read.csv("exampleDat.csv", row.names = "X")
glimpse(dat)
Rows: 2,175
Columns: 9
$ Male <int> 1, 1, 1, 1, 1, 1, 1, 1, 1, 1, 1, 0, 1, 1, 0, 0, 1, 1, 1, 0, …
$ Age <int> 0, 0, 0, 0, 0, 0, 0, 0, 0, 0, 0, 0, 0, 0, 0, 0, 0, 0, 0, 0, …
$ Chinese <int> 1, 1, 1, 1, 1, 1, 1, 1, 1, 1, 1, 1, 1, 1, 1, 1, 1, 1, 1, 1, …
$ EduF_Med <int> 0, 0, 1, 0, 1, 0, 0, 0, 0, 0, 1, 0, 1, 0, 0, 0, 0, 0, 0, 1, …
$ EduF_High <int> 1, 1, 0, 0, 0, 1, 1, 0, 1, 1, 0, 1, 0, 1, 1, 0, 1, 0, 1, 0, …
$ EduM_Med <int> 1, 0, 0, 0, 0, 0, 0, 0, 0, 0, 0, 0, 0, 1, 0, 0, 0, 0, 0, 0, …
$ EduM_High <int> 0, 1, 1, 0, 0, 0, 0, 0, 0, 1, 0, 0, 1, 0, 1, 1, 1, 1, 1, 0, …
$ EduS_Med <int> 1, 1, 1, 1, 1, 1, 1, 1, 1, 1, 1, 1, 1, 1, 1, 1, 1, 1, 1, 1, …
$ EduS_High <int> 0, 0, 0, 0, 0, 0, 0, 0, 0, 0, 0, 0, 0, 0, 0, 0, 0, 0, 0, 0, …Using mplusObject function, we can create a R object (or a Mplus model object stored in R), which holds all necessary sections for Mplus input syntax of latent class modeling. As shown in the code chunk below, users specify each Mplus section by assigning text strings to arguments. The only difference is that we don’t have to put variables’ names into a text file, instead, we can assign a R dataframe - dat to this model object directly. Then, it can be read by mplusModeler function later to run a latent class model with 2 latent classes.
In other words, we assigned text strings to three arguments -VARIABLE, ANALYSIS, SAVEDATA in mplusObject, which correspond to the sections in Mplus input file. Moreover, the most convenient part of MplusAutomation is allowing users to input variables’ names directly (usevariables = colnames(dat)). That is, rdata and usevariables arguments can be used to specify the variables’ names used for LCA in Mplus, which is equal to NAMES = in vanilla mplus input file.
After we run and extract Mplus results using mplusModeler function, the next step is to parse and extract results from another Mplus model object with results - res_m1. Here, I’m interested in model fit indices of the model, then I can use get_summaries function in R to extract those information of this 2-class latent class model. Pretty neat, right?
#------------#
# 2-class model
#------------#
m1 <- mplusObject(
  TITLE = "Latent Class Models using R;",
  VARIABLE = "
  CATEGORICAL = Male-EduS_High;
  CLASSES = c(2);",
  ANALYSIS = "
    TYPE = MIXTURE;
    ALGORITHM = INTEGRATION;
    STARTS = 500 20;
  ",
  SAVEDATA = "
    FILE IS LCA_M1_save.txt;
    SAVE IS cprob;
    FORMAT IS free;
  ",
  OUTPUT = "TECH1 TECH8;",
  rdata = dat,
  usevariables = colnames(dat),
  autov = TRUE
)
suppressWarnings(res_m1 <- mplusModeler(m1, modelout = "Mplus/model.inp", run = 1L))
summary_m1 <- get_summaries(res_m1, simplify = T)
kbl(summary_m1, digits = 3) |>
  kable_material_dark(full_width = F, html_font = "Maven Pro") |>
kable_styling(bootstrap_options = c("condensed", "hover"))| Model_1 | |
|---|---|
| Mplus.version | 8.7 |
| Title | Latent Class Models using R; |
| AnalysisType | MIXTURE |
| DataType | INDIVIDUAL |
| Estimator | MLR |
| Observations | 2175 |
| NGroups | 1 |
| NDependentVars | 9 |
| NIndependentVars | 0 |
| NContinuousLatentVars | 0 |
| NCategoricalLatentVars | 1 |
| Parameters | 19 |
| ChiSqCategoricalPearson_Value | 2255.894 |
| ChiSqCategoricalPearson_DF | 491 |
| ChiSqCategoricalPearson_PValue | 0 |
| ChiSqCategoricalLRT_Value | 1669.323 |
| ChiSqCategoricalLRT_DF | 491 |
| ChiSqCategoricalLRT_PValue | 0 |
| ChiSqMCARUnrestrictedPearson_Value | 54.839 |
| ChiSqMCARUnrestrictedPearson_DF | 637 |
| ChiSqMCARUnrestrictedPearson_PValue | 1 |
| ChiSqMCARUnrestrictedLRT_Value | 26.06 |
| ChiSqMCARUnrestrictedLRT_DF | 637 |
| ChiSqMCARUnrestrictedLRT_PValue | 1 |
| LL | -8527.781 |
| LLCorrectionFactor | 1.0086 |
| AIC | 17093.562 |
| BIC | 17201.573 |
| aBIC | 17141.207 |
| Entropy | 0.936 |
| AICC | 17093.9146682135 |
| Filename | model.out |
| NLatentClasses | 2 |
This is a simplistic procedure for one model. What about a bunch of models?
One most important step of latent class analysis is to select the number of latent classes, which best summarize the data. This research question can be translated to “when we have multiple alternative latent class models with different number of latent class (C), which one has optimal model fit”. The general rule of model selection is using information criterion such as AIC, BIC. Alternatively, model comparison method such as likelihood ratio test can be used to compare nested models. Here, I created a function to batch run multiple LCA across different number of classes to select the optimal models.
fitMplus <- function(data = dat, class,
                     uvars = "Male-EduS_High", auxvars= NULL,
                     modelout = NULL, savedata = NULL ) {
  ## specify the used variables
  fitIndices <- c("LL", "AIC", "BIC", "aBIC", "Entropy", "T11_LMR_PValue")

  if (is.null(savedata)) {
    savedata = "Mplus/model_Temp_save.txt"
  }

  if (!is.null(auxvars)) {
    start_index = which(colnames(data) == str_split(uvars, "-")[[1]][1])
    end_index = which(colnames(data) == str_split(auxvars, "-")[[1]][2])
    modelTEMP <- mplusObject(
      TITLE = "Batch Analysis of Latent Class Models;",
      VARIABLE = paste0("
      CATEGORICAL = ", uvars, ";
      CLASSES = c(", class, ");
      AUXILIARY = ", auxvars," (R3STEP);
      "),
      ANALYSIS = "
      TYPE = MIXTURE;
      ",
      SAVEDATA =
      paste0("
      FILE IS ", savedata,";
      SAVE IS cprob;
      FORMAT IS free;
      "),
      OUTPUT = "TECH1 TECH8 TECH11;",
      rdata = data,
      usevariables = colnames(data[start_index:end_index]),
      autov = TRUE
    )
  }else{
    start_index = which(colnames(data) == str_split(uvars, "-")[[1]][1])
    end_index = which(colnames(data) == str_split(uvars, "-")[[1]][2])
    modelTEMP <- mplusObject(
      TITLE = "Batch Analysis of Latent Class Models;",
      VARIABLE = paste0("
      CATEGORICAL = ", uvars, ";
      CLASSES = c(", class, ");
      "),
      ANALYSIS = "
      TYPE = MIXTURE;
      ",
      SAVEDATA =
      paste0("
      FILE IS ", savedata,";
      SAVE IS cprob;
      FORMAT IS free;
      "),
      OUTPUT = "TECH1 TECH8 TECH11;",
      rdata = data,
      usevariables = colnames(data[start_index:end_index]),
      autov = TRUE
    )
  }

  if (!is.null(modelout)) {
    suppressMessages(resTEMP <- mplusModeler(modelTEMP, modelout = modelout, run = 1L))
  }else{
    suppressMessages(resTEMP <- mplusModeler(modelTEMP, modelout = "Mplus/modelTEMP.inp", run = 1L))
  }

  summaryTEMP <- get_summaries(resTEMP, simplify = T)
  summaryTEMP <- data.frame(X = unlist(summaryTEMP[rownames(summaryTEMP) %in% fitIndices, ]))
  colnames(summaryTEMP) = paste0(class, "-class Model")

  # return
  list(
    model = resTEMP,
    summary = t(summaryTEMP)
  )
}
Then, I ran a series of latent class models with different number of classes (from 2 to 7 latent classes):
lcmFit = as.data.frame(Reduce(rbind, future_map(
  2:7, \(x) fitMplus(data = dat, class = x,
                     uvars = "Male-EduS_High",
                     modelout = "Mplus/model1fit.inp",
                     savedata = "Mplus/model_Temp_save.txt")$summary
)))
knitr::kable(lcmFit, digits = 3) |>
  kable_material_dark(full_width = F, html_font = "Maven Pro") |>
kable_styling(bootstrap_options = c("condensed", "hover"))| LL | AIC | BIC | aBIC | Entropy | T11_LMR_PValue | |
|---|---|---|---|---|---|---|
| 2-class Model | -8527.781 | 17093.56 | 17201.57 | 17141.21 | 0.936 | 0 |
| 3-class Model | -8240.625 | 16539.25 | 16704.11 | 16611.97 | 0.952 | 0 |
| 4-class Model | -8049.198 | 16176.40 | 16398.10 | 16274.19 | 0.969 | 0 |
| 5-class Model | -7978.962 | 16055.92 | 16334.48 | 16178.80 | 0.951 | 0 |
| 6-class Model | -7917.136 | 15952.27 | 16287.67 | 16100.22 | 0.990 | 0 |
| 7-class Model | -7849.506 | 15837.01 | 16229.26 | 16010.04 | 0.934 | 0 |
As the table shown, 7-class model appears to have the best model fit among 6 alternative models (lowest AIC/BIC/aBIC).
MplusAutomation + R could be good tools for LCA. However, extracting information from Mplus output file is not so easy. For example, when there are auxiliary variables exists, the regression coefficients regressed on latent classes needed to be parsed and extract manually. For example, following functions can be used to extract the regression coefficients of latent class model using the 3-step approach.
#------------#
# Extract output regression table from R3Step LCA
#------------#
extract_r3step <- function(model_path){
  # browser()
  tibble(x = read_lines(model_path)) %>%
    mutate(row1 = (1:n())[str_detect(x, 'NUMBER OF OBSERVATIONS USED')],
           row2 = (1:n())[str_detect(x,
                                     '^ODDS RATIOS FOR TESTS OF CATEGORICAL LATENT VARIABLE')]) %>%
    slice((.$row1[1] + 2):(.$row2[1] - 1)) %>%
    mutate(type_comparison = str_detect(x, 'Parameterization using Reference'),
           type_colname = str_detect(x, 'Estimate'),
           type_classnum = str_detect(x, 'C#[0-9]+'),
           type_predictor = str_detect(x, '[\\.\\-0-9]+[\\s]+[\\.\\-0-9]+')) %>%
    mutate(class = ifelse(type_classnum, parse_number(x), NA),
           predictors = ifelse(type_predictor, map(x, parse_predictors), list()),
           comparison_group = cumsum(type_comparison)) %>%
    group_by(comparison_group) %>%
    mutate(class_group = cumsum(type_classnum)) %>%
    ungroup() %>%
    mutate(comparison_group = ifelse(comparison_group == 0,
                                     max(class, na.rm = TRUE), comparison_group)) %>%
    group_by(comparison_group, class_group) %>%
    filter(class_group != 0) %>%
    mutate(class_group2 = class[!is.na(class)]) %>%
    ungroup() %>%
    filter(type_predictor) %>%
    select(comparison_group, class_group2, predictors) %>%
    unnest() %>%
    rename(comparison_class = comparison_group,
           class = class_group2) %>%
    mutate(estimate = as.numeric(estimate),
           se = as.numeric(se),
           tval = as.numeric(tval),
           pval = as.numeric(pval))
}

#------------#
# Read in save data from Mplus
#------------#
read_saveddata <- function(path_output, path_savedata, ...) {
  ## extract data and latent classes
  mplusOuput <- readLines(path_output)
  top <- which(str_detect(mplusOuput, "Order of variables")) # start linenumber
  bottom <- which(str_detect(mplusOuput, "Save file format")) # end linenumber
  rawVars <- mplusOuput[(top+1):(bottom-1)]
  savevarnames <- trimws(rawVars[rawVars != ""])

  ## read saved data from Mplus output
  savedDat <- read.table(path_savedata, na.strings = "*", header = FALSE,
                         col.names = savevarnames, ...)
  savedDat
}
Hope this is helpful.