install.packages("dslabs")
library(dslabs)Today’s Class
- R objects
- Data types
- Vectors
- Coercion
- Not available (NA)
- Sorting
- Vector arithmetic
- Indexing
Preparation
Install and load
dslabspackage
R Objects
Data Types
- Variables are most frequently used R object.
- Variables can be of different types. Some examples of variables are:
character/numeric/logical variablevectorlist (data.frame)matrix
CautionUseclass()to check objects’ typelibrary("dslabs") class("Hello World")[1] "character"class(3)[1] "numeric"class(TRUE)[1] "logical"class(murders)[1] "data.frame"
Data frames
The most common way of storing a dataset in R is in a data frame.
- We will use
murdersdata in thedslabspackage as the example:- state. US state
- abb. Abbreviation of US state
- region. Geographical US region
- population. State population (2010)
- total. Number of gun murders in state (2010)
- We will use
we can think of a data frame as a table with rows representing observations and the different variables reported for each observation defining the columns.
head(murders)state abb region population total 1 Alabama AL South 4779736 135 2 Alaska AK West 710231 19 3 Arizona AZ West 6392017 232 4 Arkansas AR South 2915918 93 5 California CA West 37253956 1257 6 Colorado CO West 5029196 65Most pre-built datasets are stored in R packages For example, you can access the
murdersby loading thedslabspackage.class(murders)[1] "data.frame"
Some helpful functions that you can find out more about the structure of data frame.
str(murders) # structure of the data frame'data.frame': 51 obs. of 5 variables: $ state : chr "Alabama" "Alaska" "Arizona" "Arkansas" ... $ abb : chr "AL" "AK" "AZ" "AR" ... $ region : Factor w/ 4 levels "Northeast","South",..: 2 4 4 2 4 4 1 2 2 2 ... $ population: num 4779736 710231 6392017 2915918 37253956 ... $ total : num 135 19 232 93 1257 ...tail(murders)state abb region population total 46 Vermont VT Northeast 625741 2 47 Virginia VA South 8001024 250 48 Washington WA West 6724540 93 49 West Virginia WV South 1852994 27 50 Wisconsin WI North Central 5686986 97 51 Wyoming WY West 563626 5murders$population # method 1: access the specific column[1] 4779736 710231 6392017 2915918 37253956 5029196 3574097 897934 [9] 601723 19687653 9920000 1360301 1567582 12830632 6483802 3046355 [17] 2853118 4339367 4533372 1328361 5773552 6547629 9883640 5303925 [25] 2967297 5988927 989415 1826341 2700551 1316470 8791894 2059179 [33] 19378102 9535483 672591 11536504 3751351 3831074 12702379 1052567 [41] 4625364 814180 6346105 25145561 2763885 625741 8001024 6724540 [49] 1852994 5686986 563626murders[["population"]] # method 2: access the specific column[1] 4779736 710231 6392017 2915918 37253956 5029196 3574097 897934 [9] 601723 19687653 9920000 1360301 1567582 12830632 6483802 3046355 [17] 2853118 4339367 4533372 1328361 5773552 6547629 9883640 5303925 [25] 2967297 5988927 989415 1826341 2700551 1316470 8791894 2059179 [33] 19378102 9535483 672591 11536504 3751351 3831074 12702379 1052567 [41] 4625364 814180 6346105 25145561 2763885 625741 8001024 6724540 [49] 1852994 5686986 563626murders[["flower"]] # it will say "NULL" when the column doesn't existNULLmurders$flower # it will say "NULL" when the column doesn't existNULLnames(murders) # variables' name[1] "state" "abb" "region" "population" "total"
Vectors
The object
murders$populationis not one number but several. We call these types of objects vectors.A vector is a combination of values with the same type* (except NA)
A single number is technically a vector of length 1, but in general we use the term vectors to refer to objects with several entries.
Some helpful functions that tells you more about the vector
pop <- murders$population
length(pop) # how many entries are in the vector
[1] 51pop[5] # extract 5th entries from the vector[1] 37253956class(pop) # one vector has only have one data types (except list)[1] "numeric"class(murders$state)[1] "character"
One special vector is logical vector. It must be either
TRUE(1) orFALSE(0), which are special values in RTRUE == 1[1] TRUE"TRUE" == 1[1] FALSEz <- c(2, 3, 7, 8, 10) LargerThanFive <- (z > 5) LargerThanFive[1] FALSE FALSE TRUE TRUE TRUEz[LargerThanFive][1] 7 8 10class(LargerThanFive)[1] "logical"EqualToSeven <- (z == 7) print(EqualToSeven)[1] FALSE FALSE TRUE FALSE FALSEHere,
>is a relational operator. You can use the relational operator like,<,<=,>=,==(is equal to),!=(is not equal to) to elementwise compare variables in vectors.identicalfunction could be use to determine whether two objects are the same.identical(z, c(2, 3, 7, 8, 10))[1] TRUE
Factors
Factors are another type of vectors that are useful for storing categorical data with a few levels.
For example, in
murdersdataset, we can see there are only 4 regions
class(murders$region)[1] "factor"levels(murders$region)[1] "Northeast" "South" "North Central" "West" table(murders$region)
    Northeast         South North Central          West
9 17 12 13 - In the background, R stores these levels as integers and keeps a map to keep track of the labels.
- We can manipulate the order of the factor based on another variables using
reorderfunction
region <- murders$region
levels(region)
[1] "Northeast" "South" "North Central" "West" value <- murders$total # the total number of murder
region_ordered <- reorder(region, value, FUN = sum)
levels(region_ordered)[1] "Northeast" "North Central" "West" "South" south_as_reference <- factor(region, levels = c("South", "Northeast", "North Central", "West"))
levels(south_as_reference)[1] "South" "Northeast" "North Central" "West" library(dplyr)
murders |>
group_by(region) |>
summarise(total_value = sum(total))# A tibble: 4 × 2
region total_value
<fct> <dbl>
1 Northeast 1469
2 South 4195
3 North Central 1828
4 West 1911List
- Data frames are a special case of lists. Lists are useful because you can store any combination of different types. You can create a list using the list function like this:
record <- list(name = "John Doe",
             student_id = 1234,
             grades = c(95, 82, 91, 97, 93),
final_grade = "A")- This list includes a character, a number, a vector with five numbers, and another character.
record$name
[1] "John Doe"
$student_id
[1] 1234
$grades
[1] 95 82 91 97 93
$final_grade
[1] "A"class(record)[1] "list"- The same function to extract columns from data frames can also be used to list:
record$student_id[1] 1234record[["student_id"]][1] 1234- You might also encounter lists without variable names.
record2 <- list("John Doe", 1234)
record2
[[1]]
[1] "John Doe"
[[2]]
[1] 1234record2[[1]][1] "John Doe"Matrix
Matrices are similar to data frames in that they are two-dimensional: they have rows and columns.
However, like numeric, character and logical vectors, entries in matrices have to be all the same type.
Yet matrices have a major advantage over data frames: we can perform matrix algebra operations, a powerful type of mathematical technique.
We can define a matrix using the
matrixfunction. We need to specify the data in the matrix as well as the number of rows and columns.mat <- matrix(data = 1:12, nrow = 4, ncol = 3) # 4 rows and 3 columns mat[,1] [,2] [,3] [1,] 1 5 9 [2,] 2 6 10 [3,] 3 7 11 [4,] 4 8 12
You can access specific entries in a matrix using square brackets (
[). If you want the second row, third column, you use:mat[2, 3][1] 10If you want the entire second row, you leave the column spot empty:
mat[2, ][1] 2 6 10Similarly, if you want the entire third column or 2 to 3 columns, you leave the row spot empty:
mat[, 3][1] 9 10 11 12mat[, 2:3][,1] [,2] [1,] 5 9 [2,] 6 10 [3,] 7 11 [4,] 8 12
Exercise 02-01
Make sure the US murders dataset is loaded. Use the function
strto examine the structure of the murders object. Which of the following best describes the variables represented in this data frame?- The 51 states.
- The murder rates for all 50 states and DC.
- The state name, the abbreviation of the state name, the state’s region, and the state’s population and total number of murders for 2010.
strshows no relevant information.
What are the column names used by the data frame for these five variables?
Use the accessor
$to extract the state abbreviations and assign them to the objecta. What is the class of this object?Now use the square brackets to extract the state abbreviations and assign them to the object
b. Use the identical function to determine if a and b are the same.We saw that the region column stores a factor. You can corroborate this by typing:
class(murders$region)With one line of code, use the functions levels and length to determine the number of regions defined by this dataset.
- The function
tabletakes a vector and returns the frequency of each element. You can quickly see how many states are in each region by applying this function. Use this function in one line of code to create a table of number of states per region.
Other features of R objects
Naming Convention
When writing code in R, it’s important to choose variable names that are both meaningful and avoid conflicts with existing functions or reserved words in the language.
Some basic rules in R are that variable names have to start with a letter, can’t contain spaces, and should not be variables that are predefined in R, such as
c.
# ------------------
this.is.a.numer <- 3
print(this.is.a.numer)
# ------------------
2 <- this.is.a.numer
`2` <- this.is.a.numer
print(2)
print(`2`)
# ------------------
`@_@` <- "funny"
paste0("You look like ", `@_@`)
# ------------------
`@this` <- 3
print(`@this`)
# ------------------
`I hate R programming` <- "No, you don't"
print(`I hate R programming`)
Workspace
We use
<-to assign values to the variables. We can also assign values using=instead of<-, but we recommend against using=to avoid confusion.coef_a <- 1 coef_b <- 1 coef_c <- -1So we have object in the global environment of R session. The workspace global environment is the place storing the objects we can use
You can see all the variables saved in your workspace by typing:
ls()[1] "coef_a" "coef_b" "coef_c" [4] "EqualToSeven" "LargerThanFive" "mat" [7] "pop" "record" "record2" [10] "region" "region_ordered" "south_as_reference" [13] "value" "z"
In RStudio, the Environment tab shows the values:
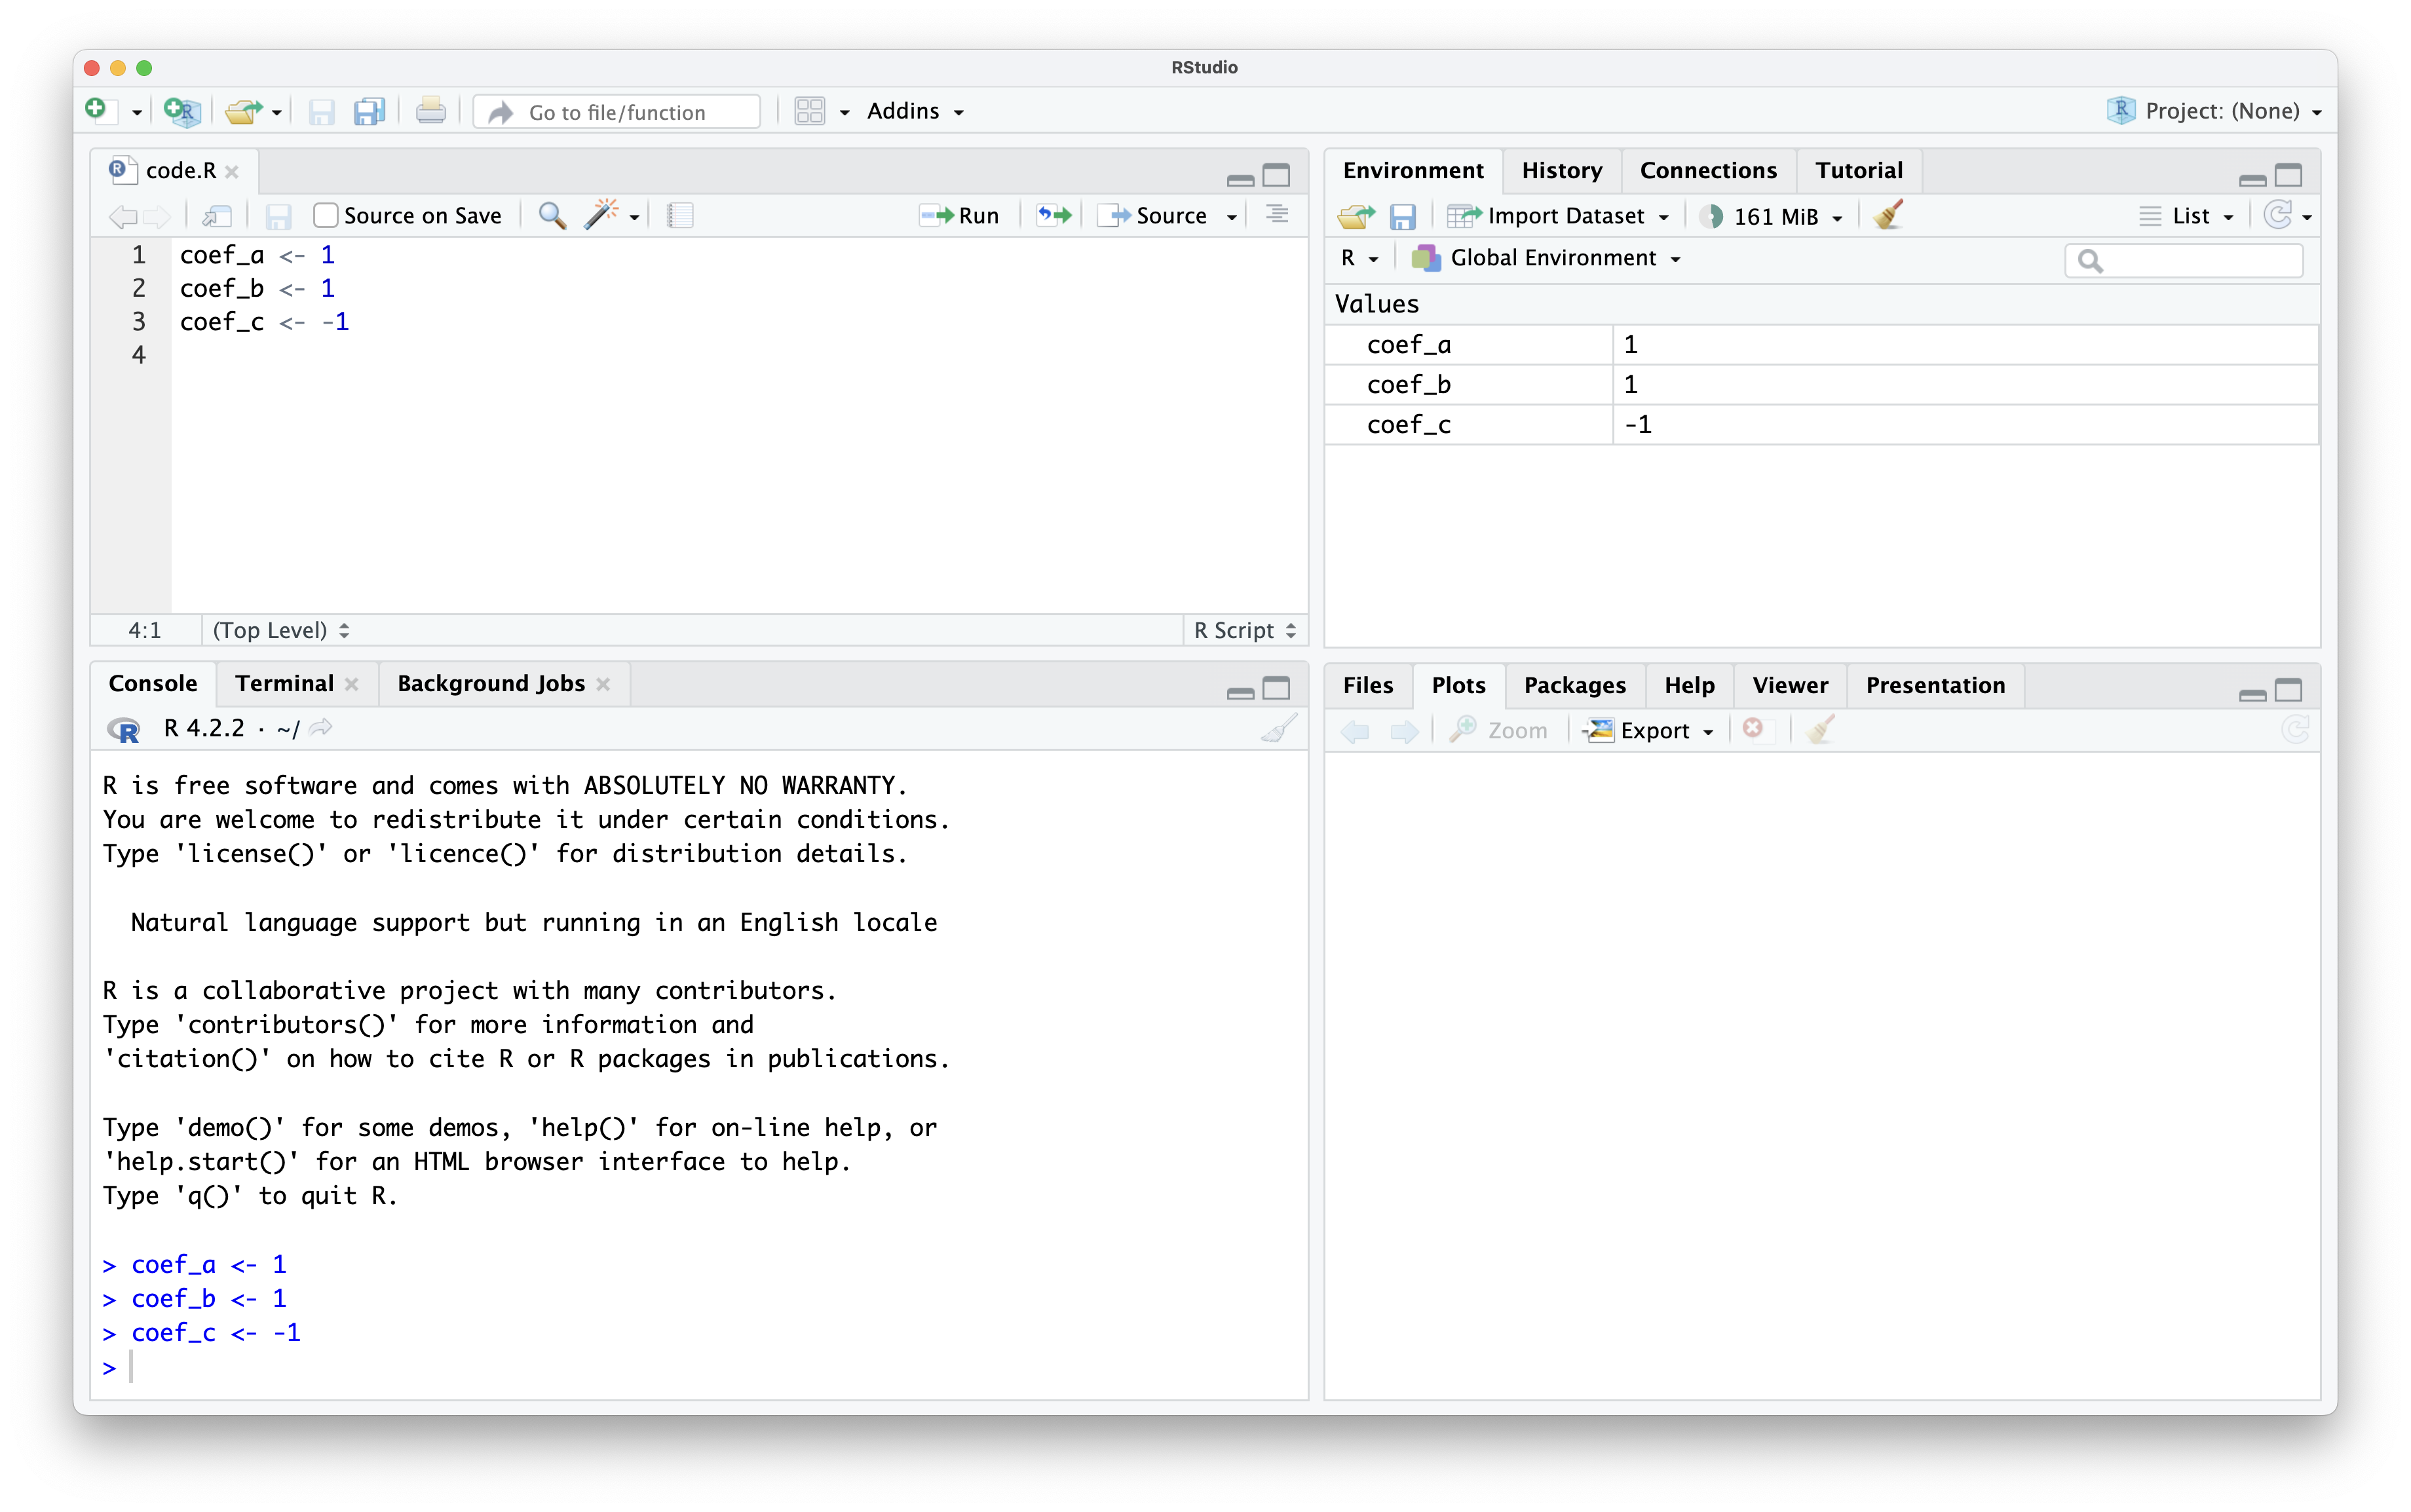
We should see
coef_a,coef_b, andcoef_c.Missing R object in workspace: If you try to recover the value of a variable that is not in your workspace, you receive an error. For example, if you type
some_random_objectyou will receive the following message:Error: object 'some_random_object' not found.print(some_random_object)Error: object 'some_random_object' not foundNow since these values are saved in variables, to obtain a solution to our equation, we use the quadratic formula:
(-coef_b + sqrt(coef_b^2 - 4*coef_a*coef_c))/(2*coef_a)[1] 0.618034(-coef_b - sqrt(coef_b^2 - 4*coef_a*coef_c))/(2*coef_a)[1] -1.618034
NoteOperators
-: is a negative operator which switches the sign of object+and*and/: addition, multiplication, and divisionsqrt: a prebuilt R function of calculating the squared root of the object^: exponent operator to calculate the “power” of the “base”;a^3: a to the 3rd power
Help: You can find out what the function expects and what it does by reviewing the very useful manuals included in R. You can get help by using the
helpfunction like this:help("log") ?logThe help page will show you what arguments the function is expecting. For example,
logneedsxandbaseto run.The base of the function
logdefaults tobase = exp(1)makinglogthe natural log by default.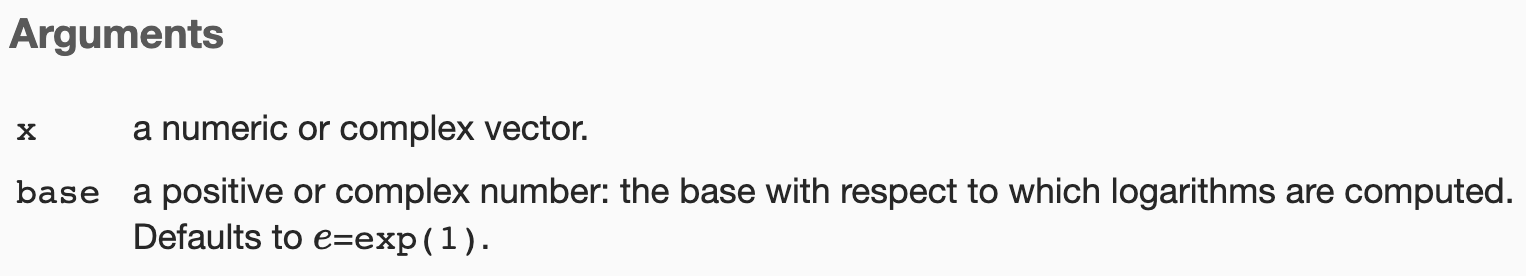
You can also use
argsto look at the argumentsargs(log)function (x, base = exp(1)) NULLlog(x = 8, base = 2)[1] 3If specifying the arguments’ names, then we can include them in whatever order we want:
log(base = 2, x = 8)[1] 3
Prebuilt objects
There are several datasets or values that are included for users to practice and test out functions. For example, you can use \pi in your calculation directly:
pi[1] 3.141593Or infinity value \infty:
Inf + 1[1] InfYou can see all the available datasets by typing:
data()For example, if you type
iris, it will output the famous (Fisher’s or Anderson’s) iris data set gives the measurements in centimeters of the variables sepal length and width and petal length and width:iris ?irisYou can check the detailed help page of
irisusing?as we did for functions.
Saving workspace
Objects and functions remain in the workspace until you end your session or erase them with the function
rm.Autosave: Your current workspaces also can be saved for later use.
- In fact, when you quit R, Rstudio asks you if you want to save your workspace as
.RData. If you do save it, the next time you start R, the program will restore the workspace.
- In fact, when you quit R, Rstudio asks you if you want to save your workspace as
ManualSave: We actually recommend against saving the workspace this way because, as you start working on different projects, it will become harder to keep track of what is saved.
save(file = "project_lecture_2.RData") # Save Workspace as project_lecture_2.RData
load("project_lecture_2.RData") # Load Workspace
Commenting your code
If a line of R code starts with the symbol
#, it is a comment and is not evaluated.- We can use this to write reminders of why we wrote particular code:
## Code to compute solution to quadratic equatio
## Define the variables
coef_a <- 3
coef_b <- 2
coef_c <- -
## Now compute the solution
(-coef_b + sqrt(coef_b^2 - 4*coef_a*coef_c))/(2*coef_a)
(-coef_b - sqrt(coef_b^2 - 4*coef_a*coef_c))/(2*coef_a)
[1] -0.8047379
Vectors
Creating Vectors
- We can create vectors using the function c, which stands for concatenate. We use c to concatenate entries in the following way:
codes <- c(380, 124, 818)
codes
[1] 380 124 818- We can also create character vectors. We use the quotes to denote that the entries are characters rather than variable names.
country <- c("italy", "canada", "egypt")- In R you can also use single quotes:
country <- c('italy', 'canada', 'egypt')But be careful not to confuse the single quote ' with the back quote `.
- By now you should know that if you type:
country <- c(italy, canada, egypt)Error: object 'italy' not foundyou receive an error because the variables italy, canada, and egypt are not defined. If we do not use the quotes, R looks for variables with those names and returns an error.
Named vectors
- Sometimes it is useful to name the entries of a vector. For example, when defining a vector of country codes, we can use the names to connect the two:
codes <- c(italy = 380, canada = 124, egypt = 818)
codes
italy canada egypt
380 124 818 class(codes)[1] "numeric"length(codes)[1] 3names(codes)[1] "italy" "canada" "egypt" str(codes) Named num [1:3] 380 124 818
- attr(*, "names")= chr [1:3] "italy" "canada" "egypt"Sequences
- Another useful function for creating vectors generates sequences:
seq(1, 10) [1] 1 2 3 4 5 6 7 8 9 10
Note
The first argument defines the start, and the second defines the end which is included.
- The default is to go up in increments of 1, but a third argument lets us tell it how much to jump by:
seq(1, 10, 2)[1] 1 3 5 7 9- If we want consecutive integers, we can use the following shorthand:
1:10 [1] 1 2 3 4 5 6 7 8 9 10Subsetting
- We use square brackets to access specific elements of a vector.
codes italy canada egypt
380 124 818 codes[2]canada
124 codes[c(1,3)]italy egypt
380 818 codes[1:2] italy canada
380 124 codes["canada"]canada
124 codes[c("egypt","italy")]egypt italy
818 380 Exercise 02-02
What is the sum of the first 100 positive integers? The formula for the sum of integers 1 through n is n(n+1)/2. Define
n=100 and then use R to compute the sum of 1 through 100 using the formula. What is the sum?
Now use the same formula to compute the sum of the integers from 1 through 1000.
Look at the result of typing the following code into R:
- Based on the result, what do you think the functions
seqandsumdo? You can use help.
- Based on the result, what do you think the functions
n <- 1000
x <- seq(1, n)
sum(x)
[1] 500500- In math and programming, we say that we evaluate a function when we replace the argument with a given value. So if we type
sqrt(4), we evaluate thesqrtfunction. In R, you can evaluate a function inside another function. The evaluations happen from the inside out. Use one line of code to compute the log (uselog()function), in base 10, of the square root of 100.
Coercion
- When an entry does not match the expected, some of the prebuilt R functions try to guess what was meant before throwing an error.
x <- c(1, "canada", 3)
print(x)
[1] "1" "canada" "3" class(x)[1] "character"
Note
R coerced the data into characters. It guessed that because you put a character string in the vector, you meant the 1 and 3 to actually be character strings "1" and "3".
- R also offers functions to change from one type to another. For example, you can turn numbers into characters with:
x <- 1:5
y <- as.character(x)
y
[1] "1" "2" "3" "4" "5"sum(x)[1] 15sum(y)Error in sum(y): invalid 'type' (character) of argumentsum(as.numeric(y))[1] 15Not availables (NA)
- A special value called an
NAfor “not available”:
x <- c("1", "b", "3")
as.numeric(x)
[1] 1 NA 3You can also calculate the summary statistics of vector including
NAusingsumormean- The solution is add
na.rmargument to remove theNAfrom the vector
- The solution is add
sum(x)Error in sum(x): invalid 'type' (character) of argumentsum(x, na.rm = TRUE)Error in sum(x, na.rm = TRUE): invalid 'type' (character) of argumentSorting
- We can sort the numeric vector from largest to lowest using
sort
library(dslabs)
sort(murders$total)
[1] 2 4 5 5 7 8 11 12 12 16 19 21 22 27 32
[16] 36 38 53 63 65 67 84 93 93 97 97 99 111 116 118
[31] 120 135 142 207 219 232 246 250 286 293 310 321 351 364 376
[46] 413 457 517 669 805 1257- To identify the index that sorts input vectors, we can use
order:
position_of_rankings = order(murders$total)
position_of_rankings
[1] 46 35 30 51 12 42 20 13 27 40 2 16 45 49 28 38 8 24 17 6 32 29 4 48 7
[26] 50 9 37 18 22 25 1 15 41 43 3 31 47 34 21 36 26 19 14 11 23 39 33 10 44
[51] 5murders[position_of_rankings, ] state abb region population total
46 Vermont VT Northeast 625741 2
35 North Dakota ND North Central 672591 4
30 New Hampshire NH Northeast 1316470 5
51 Wyoming WY West 563626 5
12 Hawaii HI West 1360301 7
42 South Dakota SD North Central 814180 8
20 Maine ME Northeast 1328361 11
13 Idaho ID West 1567582 12
27 Montana MT West 989415 12
40 Rhode Island RI Northeast 1052567 16
2 Alaska AK West 710231 19
16 Iowa IA North Central 3046355 21
45 Utah UT West 2763885 22
49 West Virginia WV South 1852994 27
28 Nebraska NE North Central 1826341 32
38 Oregon OR West 3831074 36
8 Delaware DE South 897934 38
24 Minnesota MN North Central 5303925 53
17 Kansas KS North Central 2853118 63
6 Colorado CO West 5029196 65
32 New Mexico NM West 2059179 67
29 Nevada NV West 2700551 84
4 Arkansas AR South 2915918 93
48 Washington WA West 6724540 93
7 Connecticut CT Northeast 3574097 97
50 Wisconsin WI North Central 5686986 97
9 District of Columbia DC South 601723 99
37 Oklahoma OK South 3751351 111
18 Kentucky KY South 4339367 116
22 Massachusetts MA Northeast 6547629 118
25 Mississippi MS South 2967297 120
1 Alabama AL South 4779736 135
15 Indiana IN North Central 6483802 142
41 South Carolina SC South 4625364 207
43 Tennessee TN South 6346105 219
3 Arizona AZ West 6392017 232
31 New Jersey NJ Northeast 8791894 246
47 Virginia VA South 8001024 250
34 North Carolina NC South 9535483 286
21 Maryland MD South 5773552 293
36 Ohio OH North Central 11536504 310
26 Missouri MO North Central 5988927 321
19 Louisiana LA South 4533372 351
14 Illinois IL North Central 12830632 364
11 Georgia GA South 9920000 376
23 Michigan MI North Central 9883640 413
39 Pennsylvania PA Northeast 12702379 457
33 New York NY Northeast 19378102 517
10 Florida FL South 19687653 669
44 Texas TX South 25145561 805
5 California CA West 37253956 1257Ranking
- The function
rankis also related to order and can be useful:
x <- c(31, 4, 15, 92, 65)
rank(x)
[1] 3 1 2 5 4orderandsortare functions for sorting the data frame.rankis more easy to used for filter certain cases with specific ranking.
murders[rank(murders$total) == 1, ] state abb region population total
46 Vermont VT Northeast 625741 2murders[rank(murders$total) == max(rank(murders$total)), ] state abb region population total
5 California CA West 37253956 1257Vector arithmetics
You can summarize a numeric vector using some familiar math terms
- You can use
min,max,mean,median, andsdR functions to calculate summary statistics of a vector
- You can use
x <- 1:5
mean(x); median(x); min(x); max(x)
[1] 3[1] 3[1] 1[1] 5You can get positions of largest number or lowest number or certain number
x <- c(31, 4, 15, 92, 65)
which.max(x)
[1] 4which.min(x)[1] 2which(x == 4)[1] 2
Rescaling a vector
Arithmetic operations on vectors occur element-wise. For a quick example, suppose we have height in inches:
- and want to convert to centimeters. Notice what happens when we multiply
inchesby 2.54:
- and want to convert to centimeters. Notice what happens when we multiply
inches <- c(69, 62, 66, 70, 70, 73, 67, 73, 67, 70)
inches * 2.54
[1] 175.26 157.48 167.64 177.80 177.80 185.42 170.18 185.42 170.18 177.80- Similarly, if for each entry we want to compute how many inches taller or shorter than 69 inches, the average height for males, we can subtract it from every entry like this:
inches - 69 [1] 0 -7 -3 1 1 4 -2 4 -2 1Two vectors
- If we have two vectors of the same length, and we sum them in R, they will be added entry by entry as follows:
\begin{bmatrix}a\\b\\c\\d\end{bmatrix} + \begin{bmatrix}e\\f\\g\\h\end{bmatrix} = \begin{bmatrix}a+e\\b+f\\c+g\\d+h\end{bmatrix}
The same holds for other mathematical operations, such as
-,*and/.- This implies that to compute the murder rates we can simply type:
murder_rate <- murders$total / murders$population * 100000- Once we do this, we notice that California is no longer near the top of the list.
murders$state[order(murder_rate)] [1] "Vermont" "New Hampshire" "Hawaii"
[4] "North Dakota" "Iowa" "Idaho"
[7] "Utah" "Maine" "Wyoming"
[10] "Oregon" "South Dakota" "Minnesota"
[13] "Montana" "Colorado" "Washington"
[16] "West Virginia" "Rhode Island" "Wisconsin"
[19] "Nebraska" "Massachusetts" "Indiana"
[22] "Kansas" "New York" "Kentucky"
[25] "Alaska" "Ohio" "Connecticut"
[28] "New Jersey" "Alabama" "Illinois"
[31] "Oklahoma" "North Carolina" "Nevada"
[34] "Virginia" "Arkansas" "Texas"
[37] "New Mexico" "California" "Florida"
[40] "Tennessee" "Pennsylvania" "Arizona"
[43] "Georgia" "Mississippi" "Michigan"
[46] "Delaware" "South Carolina" "Maryland"
[49] "Missouri" "Louisiana" "District of Columbia"- What if the lengths of two vectors differ?
x <- c(1, 2, 3)
y <- c(10, 20, 30, 40, 50, 60, 70)
x + y
[1] 11 22 33 41 52 63 71
Warning
So if the vectors don’t match in length, it is natural to assume that we should get an error. But we don’t. Notice what happens: one vector x recycles. Another common source of unnoticed errors in R is the use of recycling.
Index
R provides a powerful and convenient way of indexing vectors. We can, for example, subset a vector based on properties of another vector.
- Imagine you are moving from Italy where, according to an ABC news report, the murder rate is only 0.71 per 100,000. You would prefer to move to a state with a similar murder rate.
ind <- murder_rate <= 0.71
ind
[1] FALSE FALSE FALSE FALSE FALSE FALSE FALSE FALSE FALSE FALSE FALSE TRUE
[13] FALSE FALSE FALSE TRUE FALSE FALSE FALSE FALSE FALSE FALSE FALSE FALSE
[25] FALSE FALSE FALSE FALSE FALSE TRUE FALSE FALSE FALSE FALSE TRUE FALSE
[37] FALSE FALSE FALSE FALSE FALSE FALSE FALSE FALSE FALSE TRUE FALSE FALSE
[49] FALSE FALSE FALSEmurders$state[ind][1] "Hawaii" "Iowa" "New Hampshire" "North Dakota"
[5] "Vermont" murders$state[which(murder_rate <= 0.71)][1] "Hawaii" "Iowa" "New Hampshire" "North Dakota"
[5] "Vermont"
Note
Note that we get back a logical vector with TRUE for each entry smaller than or equal to 0.71. To see which states these are, we can leverage the fact that vectors can be indexed with logicals.
Logical Operation
- we can use the
&to get a vector of logicals that tells us which states satisfy both conditions:
TRUE & TRUE[1] TRUETRUE & FALSE[1] FALSEFALSE & FALSE[1] FALSE- We can find out states that meets two conditions: (1) West region (2) nyrder_rate lower than .71
west <- murders$region == "West"
safe <- murder_rate <= .71
ind <- safe & west
murders$state[ind]
[1] "Hawaii"Other Indexing: Which one & match & %in%
- The function
whichtells us which entries of a logical vector are TRUE. So we can type:
ind <- which(murders$state == "California")
ind
[1] 5murder_rate[ind][1] 3.374138- Instead of just one state we want to find out the murder rates for several states
ind <- match(c("New York", "Florida", "Texas"), murders$state)
ind
[1] 33 10 44murder_rate[ind][1] 2.667960 3.398069 3.201360- When you are uncertain, use
%in%. Imagine you are not sure if Boston, Dakota, and Washington are states.
c("Boston", "Dakota", "Washington") %in% murders$state[1] FALSE FALSE TRUEmurders$state %in% c("Boston", "Dakota", "Washington") [1] FALSE FALSE FALSE FALSE FALSE FALSE FALSE FALSE FALSE FALSE FALSE FALSE
[13] FALSE FALSE FALSE FALSE FALSE FALSE FALSE FALSE FALSE FALSE FALSE FALSE
[25] FALSE FALSE FALSE FALSE FALSE FALSE FALSE FALSE FALSE FALSE FALSE FALSE
[37] FALSE FALSE FALSE FALSE FALSE FALSE FALSE FALSE FALSE FALSE FALSE TRUE
[49] FALSE FALSE FALSEExercise 02-03
1 We will use the US murders dataset for this exercises. Make sure you load it prior to starting. Use the $ operator to access the population size data and store it as the object pop. Then use the sort function to redefine pop so that it is sorted. Finally, use the [ operator to report the smallest population size.
2 Now instead of the smallest population size, find the index of the entry with the smallest population size. Hint: use order instead of sort.
3 We can actually perform the same operation as in the previous exercise using the function which.min. Write one line of code that does this.
4 Now we know how small the smallest state is and we know which row represents it. Which state is it? Define a variable states to be the state names from the murders data frame. Report the name of the state with the smallest population.
- You can create a data frame using the data.frame function. Here is a quick example:
temp <- c(35, 88, 42, 84, 81, 30)
city <- c("Beijing", "Lagos", "Paris", "Rio de Janeiro",
          "San Juan", "Toronto")
city_temps <- data.frame(name = city, temperature = temp)
Use the rank function to determine the population rank of each state from smallest population size to biggest. Save these ranks in an object called ranks, then create a data frame with the state name and its rank. Call the data frame my_df.
Repeat the previous exercise, but this time order my_df so that the states are ordered from least populous to most populous. Hint: create an object ind that stores the indexes needed to order the population values. Then use the bracket operator [ to re-order each column in the data frame.
The na_example vector represents a series of counts. You can quickly examine the object using:
str(na_example) int [1:1000] 2 1 3 2 1 3 1 4 3 2 ...However, when we compute the average with the function mean, we obtain an NA:
mean(na_example)[1] NAThe is.na function returns a logical vector that tells us which entries are NA. Assign this logical vector to an object called ind and determine how many NAs does na_example have.
- Now compute the average again, but only for the entries that are not NA. Hint: remember the ! operator, which turns FALSE into TRUE and vice versa.