---
title: "Lecture 07: Block Design"
subtitle: "Experimental Design in Education"
date: "2025-02-27"
execute:
eval: true
echo: true
format:
html:
code-tools: true
code-line-numbers: false
code-fold: false
number-offset: 1
fig.width: 10
fig-align: center
message: false
grid:
sidebar-width: 350px
uark-revealjs:
chalkboard: true
embed-resources: false
code-fold: false
number-sections: true
number-depth: 1
footer: "ESRM 64503"
slide-number: c/t
tbl-colwidths: auto
scrollable: true
output-file: slides-index.html
mermaid:
theme: forest
---
::: objectives
## Overview {.unnumbered}
- Review different types of experimental design
- Block Design
- Rationale for using block design
- Definitions of nuisance, blocking, and confounding factors
- Complete Block Design
- Randomized Complete Block Design
- Latin Square Design (LSD)
- Replicated Latin Square Design
:::
## From week 1...
- Experimental Design (esp. Group Comparison, Mean Differences)
1. Assumption Check: Independence, Normality, HOV
2. One-way ANOVA: Factor (IV), Outcome (DV)
3. Post-hoc test: Unplanned, Planned
## Review of One-Way ANOVA
+----------------------------------------+--------------------------------------------------------------------------------------------------------------------------------------+
| Step | ANOVA |
+========================================+======================================================================================================================================+
| Alternative Hypothesis | $H_1$: groups do not come from the same population/ there is at least one group difference in the population |
+----------------------------------------+--------------------------------------------------------------------------------------------------------------------------------------+
| Null Hypothesis | $H_0$: groups come from the same population/ there are no group differences in the population |
+----------------------------------------+--------------------------------------------------------------------------------------------------------------------------------------+
| Distribution of F-stats under the null | - df numerator ($df_b$): k - 1 |
| | |
| | - df denominator ($df_w$): N - k |
| | |
| | - For the shape to hold, must meet the following assumptions: |
| | |
| | 1. Independence of Observations |
| | 2. Normality |
| | 3. Homogeneity of Variance |
+----------------------------------------+--------------------------------------------------------------------------------------------------------------------------------------+
| Compute F-statistic | $F = \frac{SS_b / df_b}{SS_w/df_w} = \frac{MS_b}{MS_w}$ |
| | |
| | `aov()` and `summary()` in R |
+----------------------------------------+--------------------------------------------------------------------------------------------------------------------------------------+
| Make a statistical conclusion | If F-statistic is greater than the F-critical (or p-value is smaller than alpha), reject the null. Report and interpret effect sizes |
+----------------------------------------+--------------------------------------------------------------------------------------------------------------------------------------+
## Review of Randomized Experiments
- **Randomized experiments** allow researchers to scientifically measure the impact of an intervention on a particular outcome of interest. (e.g., intervention methods on performance)
- The key to randomized experimental research design is in the **random assignment** of study subjects:
- For example, randomly assign individual people, classrooms, or some other group – into [a) treatment or b) control groups]{.redcolor}.
- **Randomization** means that care is taken to ensure that no pattern exists between the assignment of subjects into groups and any characteristics of those subjects.
- Ex: not all females over 30 into the exercise group, females 18-30 in the diet group, and males into the control group.
- Every subject is as likely as any other to be assigned to the treatment (or control) group.
## In this week: block design
- **ANOVA is not limited to one independent variable**
- **Adding a Second IV comes in two forms:**
- **Blocking: want to statistically control for some IV**
- Controlling for a factor that influences the DV, but is not of primary interest to the researcher
- Blocks in education might include school, class, or grade.
- There might be differences among schools, but we might not care to investigate if one particular school has a different result than another. Still, we want to take these differences into account statistically.
- **Factorial design: design with more than one IV**
- Two treatment factors that interact (e.g., gender (Male vs. Female) x age (Childhood vs. Youth))
## In this week: why block design
- **We used a one-way ANOVA to compare means of two or more groups**
- Example: Effect of tutoring on student grades
- One categorical independent variable (three groups: no tutor, once/week, daily)
- One continuous dependent variable (grades)
- **What if we want to examine another independent variable?**
- Example: Type of school setting: Public, private-secular, and private-religious
- That is, we think the effect of tutoring on grades might depend on the school setting, so we want to control for school setting.
- **We can use ANOVA with more than one IV in this case**
- Two or more categorical independent variables (factors)
- One continuous dependent variable
## In this week
- Offers several advantages over a one-way ANOVA:
1. [Allows for greater generalizability of results:]{.redcolor}\
- More realistic (life is complex!)
- Allows for investigation of interactions through FACTORIAL ANOVA
2. [We can ask whether the effect of one variable depends on the level of another variable]{.redcolor}
- Example: cancer trials; Does the effect of the treatment method depend on stage of cancer?
- Economical: requires fewer participants than two one-way designs for the same level of power.
------------------------------------------------------------------------
- Offers several advantages over a one-way ANOVA:
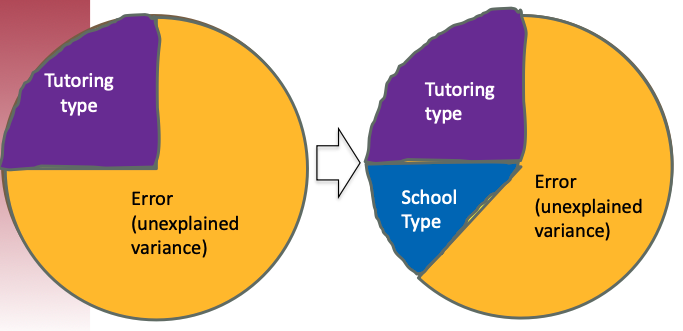
3. [Smaller error terms means we have more power]{.redcolor}
- For the one-way ANOVA, we are able to account for more of the variance by adding additional factors
- For example, let's say we are interested in tutoring type's effect on grades, but we already know that school type also affects performance
::::: columns
::: column
:::
::: {.column .callout-note}
## Suggestion
Assume that we include tutoring type as the IV. However, we do not include school type at first:
1. Adding school type as an IV explains more variance, thus reducing the amount of error variance
2. Remember we define error as anything NOT explained by the IVs
3. Even though "school" may not be of research interest, there are still some statistical benefits.
:::
:::::
## Blocking factors or Nuisance factors
- When adding more IVs into the models, experimental researchers have identified different types of factors:
- **Nuisance factors**
- **Blocking factors**: A special type of nuisance factors
- **Confounding factors**
- Other terminology:
- experimental unit: the target being applied treatment to
- replicates: experimental unit may be measured multiple times.
- **Blocking factors** and **nuisance factors** help control unwanted variation between experimental units, reducing error in our analysis.
- **Block designs help maintain internal validity** by reducing the possibility that the observed effects are due to a **confounding factor.**
- Confounding factor = a factor that impacts both IV and DV
- While also **maintaining external validity** by allowing the investigator to use less stringent restrictions on the sampling population.
## Block design
- **When we have a single blocking factor, we utilize a randomized complete block design (RCBD).**
- cf. completely randomized design (CRD) = cares about the randomly assigned treatment
- Randomized complete block design (RCBD) = CRD with the blocking
- Today, we will see extensions when more than a single blocking factor exists
- Example: Latin Squares and their generalizations
- These designs are efficient in terms of power and reducing the error variation.
## Why Use Blocking: Confounding Variables
- In designing a study, researchers need to anticipate the factors that could undermine the **validity** of the inferences.
- Validity is defined as “[the approximate truth of an inference]{.redcolor}” (Shadish, Cook, & Campbell, 2002). Validity is a property of the inferences, not of the research design.
- However, design elements can have a profound impact on the inferences we make.
- Many threats to validity involve inadequate control over **confounding variables**.
- A confounding variable is an “extra” variable that the researcher did not account for.
- **Confounding variables:** are any other variable that also has an effect on your dependent variable. They are like extra independent variables that are having a hidden effect on your dependent variables.
- They can ruin an experiment and provide the researcher with misleading results.
- Confounding variables that are not controlled for can suggest there is correlation when in fact there is not or even introduce bias, leading the researcher to find an F-statistic that is too low or too high.
- For these reasons, it is important to know what a confounding variables is, and how to avoid getting them into your experiment in the first place.
- One approach to dealing with confounding variables is through **blocking**.
## Example of Confounding Variable
- Consider a study examining the relationship between [class size]{.redcolor} and [student achievement]{.redcolor}.
- If researchers find that smaller class sizes are associated with higher achievement, they might conclude that reducing class size improves learning. However, [teacher quality]{.bluecolor} could be a confounding variable.
- If smaller classes tend to have more experienced or highly qualified teachers, the observed effect on student achievement might be due to teacher quality rather than class size itself.
--------
:::::: callout-note
## Suggestion
When designing an experiment to study the effect of **class size on student achievement** while addressing the confounding variable of **teacher quality**, researchers should consider the following strategies:
::::: columns
::: column
1. **Random Assignment**:
- Randomly assign students to different class sizes to ensure that teacher quality is evenly distributed across groups.
2. **Matching or Blocking**:
- Match teachers based on experience, qualifications, or effectiveness before assigning them to different class sizes. Alternatively, use **blocking** to ensure that teachers of similar quality are present in both small and large class groups.
3. **Control for Teacher Quality in Statistical Analysis**:
- Measure relevant teacher characteristics (e.g., years of experience, certification level, student evaluation scores) and include them as **covariates** in a regression or ANCOVA model.\
:::
::: column
4. **Within-Teacher Design**:
- Have the same teacher instruct both small and large classes (e.g., different sections of the same course). This controls for individual teacher differences and isolates the effect of class size.
5. **Longitudinal Study Design**:
- Track students over multiple years, controlling for previous achievement levels and teacher effects, to better isolate the impact of class size on student learning.
6. **Replication in Multiple Contexts**:
- Conduct the study across different schools and regions to ensure that findings are not driven by unobserved local factors, such as school funding or administrative policies.\
:::
:::::
::::::
## Another Example of Confounding Variable
- Consider a study examining the relationship between [online learning]{.redcolor} and [student performance]{.redcolor} during the pandemic.
- If researchers find that students who used online learning platforms performed better, they might conclude that online learning is more effective. However, [socioeconomic status]{.bluecolor} could be a confounding variable.
- Students from higher-income families are more likely to have:
- Access to reliable internet and technology
- Quiet study spaces at home
- Parental support for learning
- Additional tutoring resources
- The observed improvement in performance might be due to these socioeconomic advantages rather than the online learning platform itself.
## Blocking: When to use this tool
::::: columns
::: column
- Use ANOVA with Blocking to evaluate the equality of three or more means from dependent/related populations.
- This test basically performs a one-way ANOVA after accounting for the variability among the 'blocks'. Blocks are groups of similar units or repeated measurements on the same unit. ANOVA with blocking is therefore a multiple-sample application of the paired samples t-test.
:::
::: column
- The test makes [the following assumptions]{.redcolor}:
1. The data are continuous numeric.
2. The units are randomly sampled.
3. No interaction between the 'treatments' and 'blocks'.
4. The groups are normally distributed.
5. The groups have equal variances.
:::
:::::
## Blocking Factor and Nuisance Factor
::::: columns
::: column
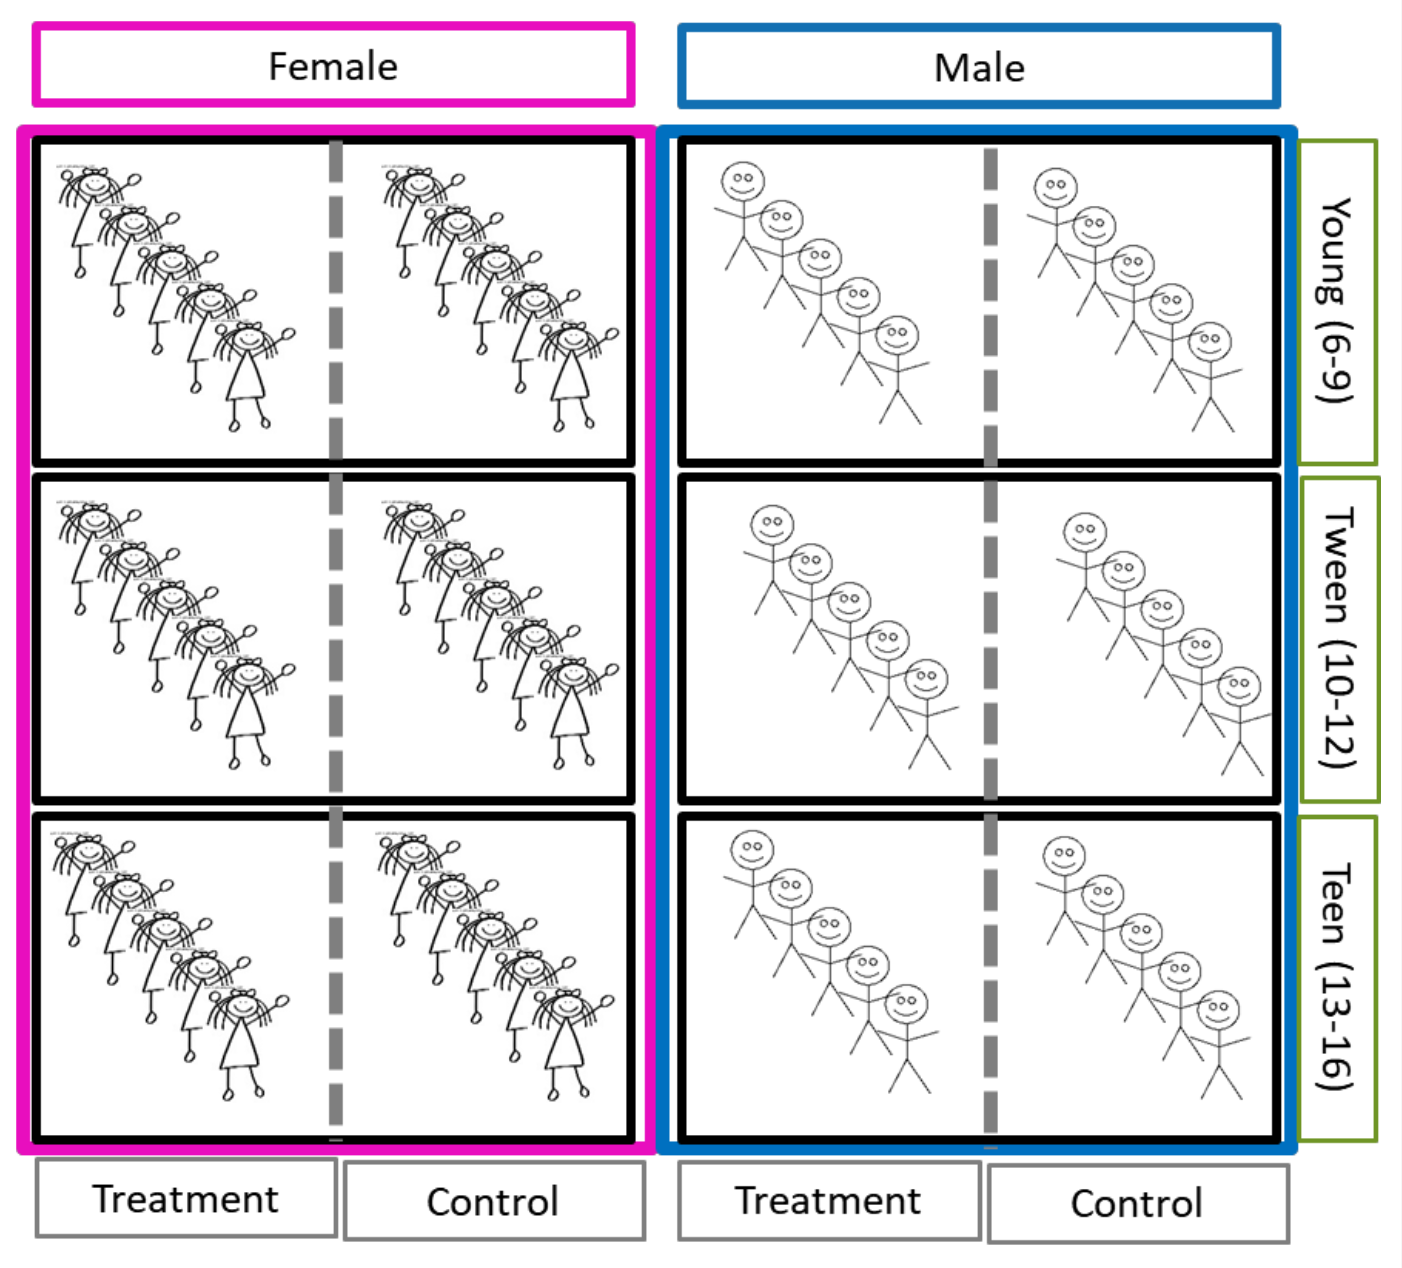
- **Example: Age and Gender**
- In studies involving human subjects, **we often use gender and age as the blocking factors.**
- We partition our subjects by gender and then into age groups.
- Thus, we have **a block of** **homogeneous subjects** defined by the combination of factors, gender and age.
- Within each block, we then randomly assign to treatment(T) or control(C).
- **Example: Age classes and gender** - **The key is that age, gender are not a part of our experimental design.**
- As we saw, we often use gender and age classes as the blocking factors.
:::
::: column
:::
:::::
## Blocking Factor and Nuisance Factor
- Sometimes, confounding variables are **nuisance factor**[^1]
- **Nuisance**: a person, thing, or circumstance causing inconvenience or annoyance.
- **Nuisance factor**: A factor that probably has an effect on the outcome, but is not a factor that we are interested in. Not considering nuisance factors will cause inaccuracy in the estimation of effects.
- E.g., Age, Institution, Sites
- **Another Example: Institution (size, location, type, etc)**
- In medical design, one blocking factor commonly used is [the type of institution]{.redcolor}.
- Hopefully removes the effects of institutionally-related factors on experiment outcomes such as size of the institution, types of populations served, hospitals versus clinics, etc.
- We expect that these factors would influence the overall results of the experiment.
- We are not manipulating the institution – this is what makes it a nuisance factor
[^1]: [PennStat STAT503](https://online.stat.psu.edu/stat503/lesson/4/4.1)
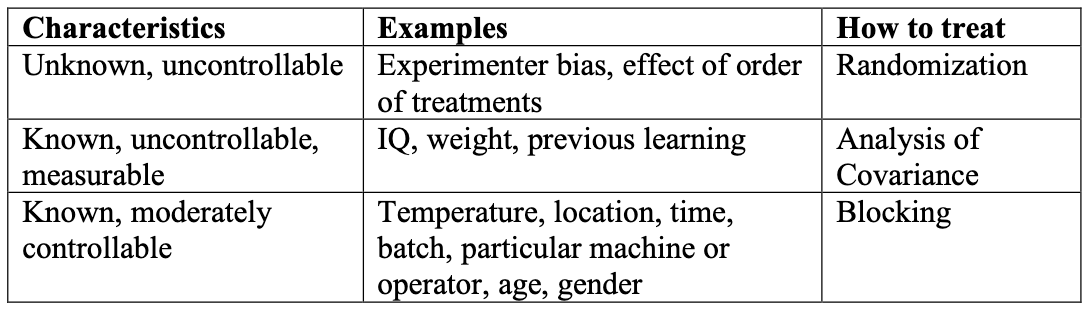
## Types of nuisance factors
- So, nuisance factor:
1. If the nuisance factor is known and controllable, we can use \"**blocking**,\" and nuisance factors become blocking factors (manipulate the block factors to make treatment samples homogeneous)
2. If the nuisance factor is known but uncontrollable, we consider **ANCOVA** (e.g., gender, class, school)
3. If the nuisance factor is unknown and uncontrollable (i.e., lurking variable), we redo the **randomization**.
## In-Class Comprehensive Quiz
::: {.panel-tabset}
## Exercise
**In-Class Quiz: Blocking Factors and Nuisance Factors**
**Research Scenario:** Dr. Smith wants to test the effectiveness of three different math tutoring methods (Method A: one-on-one tutoring, Method B: small group tutoring, Method C: online tutoring) on student math achievement scores. She plans to conduct this study across multiple elementary schools in the district.
**Given this scenario, answer the following questions:**
1. **Dr. Smith realizes that students from different schools may have different baseline math abilities due to varying resources and teaching quality. In this context, "school" would be considered:**
a) The main treatment variable
b) A blocking factor
c) The dependent variable
d) An interaction effect
2. **Dr. Smith also notices that student grade level (3rd, 4th, 5th grade) affects math performance, but she cannot control which grade students are in. How should she handle this nuisance factor?**
a) Use blocking by randomly assigning students to different grades
b) Ignore it since it's uncontrollable
c) Use ANCOVA to statistically control for grade level
d) Redo the randomization process
3. **After collecting data, Dr. Smith discovers that some teachers were more enthusiastic about certain tutoring methods, potentially affecting results. This represents which type of nuisance factor?**
a) Known and controllable - use blocking
b) Known but uncontrollable - use ANCOVA
c) Unknown and uncontrollable - redo randomization
d) This is not a nuisance factor
4. **What would be the main advantage of using schools as blocking factors in Dr. Smith's study?**
a) It allows her to study the effect of different schools
b) It increases the total number of students in the study
c) It makes students within each school more similar, reducing error variance
d) It eliminates the need to randomly assign tutoring methods
## Answer
**Answers:**
1. **b) A blocking factor**
- School would be a blocking factor because it's likely to affect math achievement (schools have different resources, teaching quality, etc.) but Dr. Smith is not interested in comparing schools. She wants to control for these school-level differences to get a cleaner test of tutoring method effectiveness.
2. **c) Use ANCOVA to statistically control for grade level**
- Since grade level is known (she can measure it) but uncontrollable (she can't randomly assign students to grades), ANCOVA is the appropriate method to statistically account for grade level differences.
3. **c) Unknown and uncontrollable - redo randomization**
- Teacher enthusiasm was not anticipated or measured beforehand, making it an unknown nuisance factor. The best approach is to improve the randomization process in future studies to ensure teachers are not systematically biased toward certain methods.
4. **c) It makes students within each school more similar, reducing error variance**
- By blocking on schools, students within each school are more homogeneous in terms of school-related factors (resources, teaching quality, etc.). This reduces the unexplained variance in the model, making it easier to detect true differences between tutoring methods.
:::
# Unit 2
## Example of randomized complete block design (RCBD)
- [Aim]{.redcolor}: We are interested in the performance of four lecture methods on math scores.
- The following math test scores (higher score = better at math) were obtained for three test forms.
::::: columns
::: {.column width="40%"}
| Lecture | Form 1 | Form 2 | Form 3 |
|----------|--------|--------|--------|
| Method 1 | 45 | 43 | 51 |
| Method 2 | 47 | 46 | 52 |
| Method 3 | 48 | 50 | 55 |
| Method 4 | 42 | 37 | 49 |
:::
::: {.column width="60%"}
- In this scenario:
- We are interested in lecture method - This is our **IV**
- Test form may have an effect, but we are not interested in it - Form is the blocking factor
- The outcome is math test score - This is the DV
- Each cell represents the average math mean in a combination of experimental settings
- Here, all lecture types are applied to all forms
:::
:::::
- This design setting is called a **"complete" block design** (CBD). We will look at blocking design variations.
## Complete Block Design (CBD) vs. Randomized CBD (RCBD)
### Complete Block Design (CBD)
In a complete block design (CBD), experimental units are grouped into blocks based on a variable that may influence the response variable. Each block contains all treatment conditions, and the treatments are not randomly assigned within blocks; instead, they follow a systematic allocation.
- Example Using the Provided Table (CBD Interpretation):
- The "Forms" (Form 1, Form 2, and Form 3) represent the blocks.
- The "Methods" (Method 1, Method 2, Method 3, and Method 4) represent the different treatments.
- Each form receives all four methods, meaning the blocking factor (Forms) is accounted for.
However, without random assignment of methods within each form, the design might introduce bias if external factors (e.g., instructor differences) influence the results.
------------------------------------------------------------------------
### Randomized Complete Block Design (RCBD)
In a randomized complete block design (RCBD), the blocking factor is still used, but the treatment assignments within each block are randomized to reduce systematic bias.
- Example Using the Provided Table (RCBD Interpretation):
- Forms still act as blocks.
- **Instead of assigning methods in a predetermined order, the four methods are randomly assigned within each form.**
- This ensures that any systematic influence of form characteristics is minimized and does not confound treatment effects.
## Randomized Complete Block Design (RCBD)
- The mean comparison among specific blocks ($\mu_{form1}$, $\mu_{form2}$, $\mu_{form3}$, $\mu_{form4}$) is not of interest
- In a RCBD, the variation between blocks is partitioned out of the MSE, resulting in a smaller MSE for testing hypotheses about the treatments.
$$
Y_{ij} = \mu + \tau_i + \rho_j + \epsilon_{ij}
$$
where:
1. $Y_{ij}$: math scores for Method *i* and Form *j*
2. $\mu$: grand mean
3. $\tau_i$: Method *i* effect with *i* = 1, ..., 4
4. $\rho_j$: Form *j* effect with *j* = 1, 2, 3
5. $\rho_j$ and $\epsilon_{ij}$ are independent random variables such that $\rho_j \sim \mathcal{N}(0, \sigma^2_{\rho})$ and $\epsilon_{ij} \sim \mathcal{N}(0, \sigma^2_{\epsilon})$
------------------------------------------------------------------------
## Randomized Complete Block Design (RCBD)
- When we have a single blocking factor (Form), we utilize a [randomized complete block design]{.bluecolor} (RCBD)[^2].
- *b* blocks, each with *a* treatment levels (a = 4, b = 3)
- *a* treatment levels are randomly assigned within each block
- In this case, we have 3 blocks ([Form 1]{.red}, [Form 2]{.green}, [Form 3]{.purple}), each having 4 treatment levels.
[^2]: PennStat [STAT502](https://online.stat.psu.edu/stat502/lesson/7/7.3)
:::::: columns
::: {.column width="40%"}
| Lecture | Form 1 | Form 2 | Form 3 |
|----------|:----------:|:------------:|:-------------:|
| Method 1 | [45]{.red} | [43]{.green} | [51]{.purple} |
| Method 2 | [47]{.red} | [46]{.green} | [52]{.purple} |
| Method 3 | [48]{.red} | [50]{.green} | [55]{.purple} |
| Method 4 | [42]{.red} | [37]{.green} | [49]{.purple} |
:::
:::: {.column width="60%"}
::: {.callout-note collapse="true"}
- Numbers in each cell are means
- Within each block, we have designed a more homogenous set of experimental units on which to test math scores.
- Variability **between** blocks can be large, since we will remove this source of variability, whereas variability **within** a block should be relatively small. In general, a block is a specific level of the nuisance factor.
:::
::::
::::::
------------------------------------------------------------------------
+------------+--------------+----------------+------------------+------------+
| Lecture | Form 1 | Form 2 | Form 3 | Marginal |
+============+:============:+:==============:+:================:+:==========:+
| Method 1 | [45]{.red} | [43]{.green} | [51]{.purple} | 46.33 |
+------------+--------------+----------------+------------------+------------+
| Method 2 | [47]{.red} | [46]{.green} | [52]{.purple} | 48.33 |
+------------+--------------+----------------+------------------+------------+
| Method 3 | [48]{.red} | [50]{.green} | [55]{.purple} | 51.00 |
+------------+--------------+----------------+------------------+------------+
| Method 4 | [42]{.red} | [37]{.green} | [49]{.purple} | 42.67 |
+------------+--------------+----------------+------------------+------------+
| Marginal | [46.3]{.red} | [44.0]{.green} | [51.75]{.purple} | |
+------------+--------------+----------------+------------------+------------+
```{r}
#| code-fold: true
#| code-summary: "Output of ANOVA"
#| results: hold
#| warning: false
#| message: false
library(tidyverse)
exp <- tribble(
  ~method, ~F1, ~F2, ~F3,
  1, 45,43,51,
  2, 47,46,52,
  3, 48,50,55,
  4, 42,37,49
)

exp_l <- exp |>
  mutate(method = factor(method, levels = 1:4)) |>
  pivot_longer(F1:F3, names_to = "block", values_to = "score")
summary(aov(score ~ block + method, data = exp_l))
```
------------------------------------------------------------------------
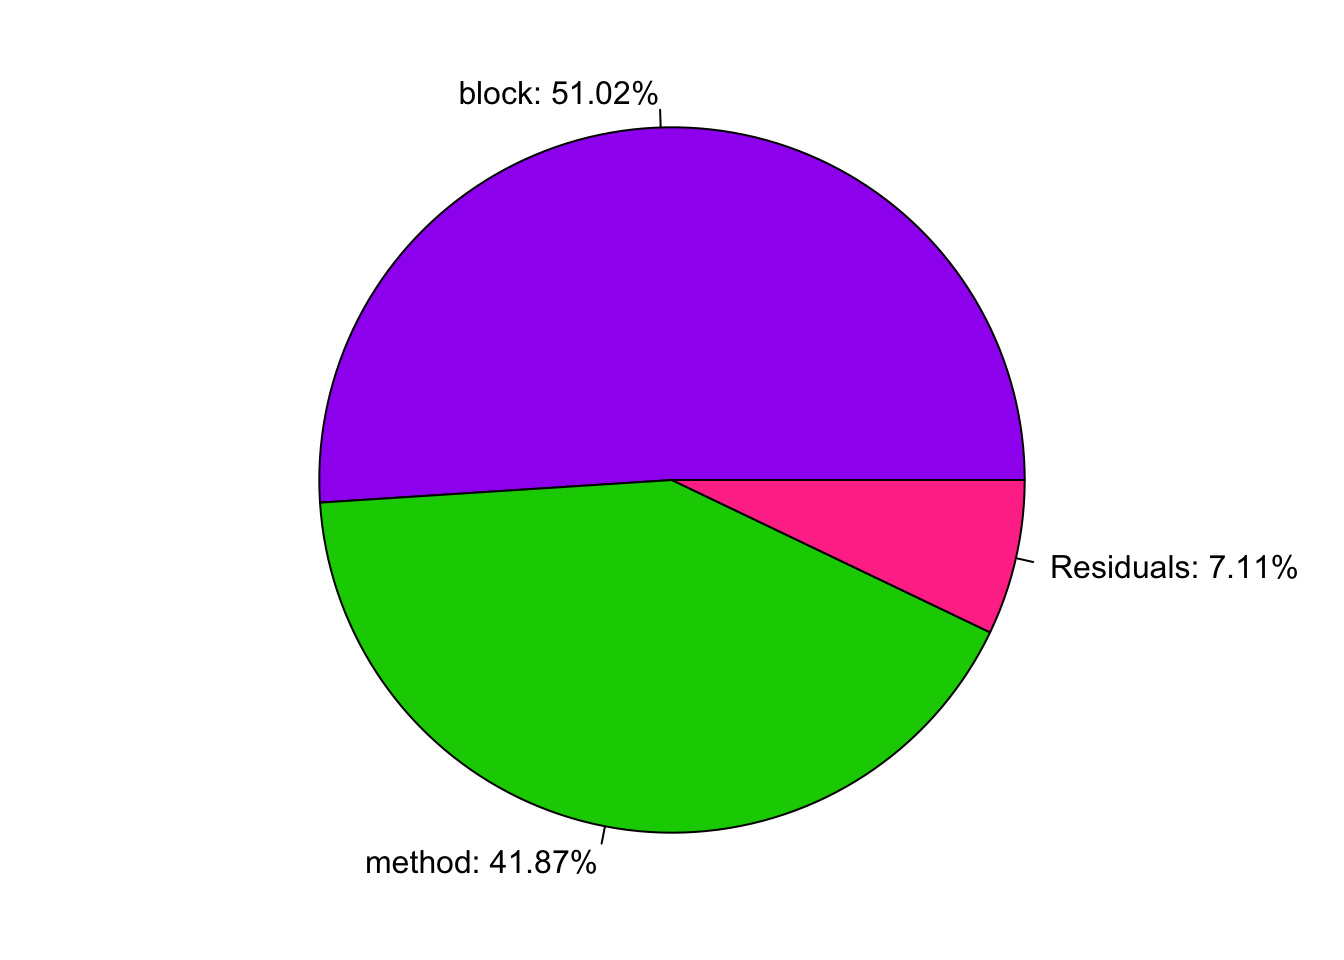
### Proportion of Sum of Square
::::: columns
::: column
```{r}
aov_fit <- aov(score ~ block + method, data = exp_l)
summary(aov_fit)
```
:::
::: column
```{r}
#| echo: false
par(mar = c(.1, .1, .1, .1))
x <- summary(aov_fit)[[1]]
SS <- x$`Sum Sq`
names(SS) <- trimws(rownames(x))
pie(SS, col = c("purple", "green3", "violetred1"),
labels = paste0(names(SS), ": ", round(SS / sum(SS) * 100, 2), "%"))
```
:::
:::::
::::: columns
::: column
```{r}
stats::TukeyHSD(aov_fit)$method |> round(2)
```
:::
::: column
- After removing the variability of the blocking factor (forms), we observed significant Group Differences using block design in the following group pairs:
- Method 4 vs. 2;
- Method 4 vs. 3;
:::
:::::
## Latin Square Design
- Allow for **two blocking factors**.
- Used to simultaneously control (or eliminate) two sources of nuisance variability.
- **Latin Square Design** gets its name from the fact that we can write it as a square with Latin letters to correspond to the treatments.
- The treatment factor levels are the Latin letters in the Latin square design.
- The number of rows and columns correspond to the number of treatment levels.
- So, if we have four treatments then we would need to have four rows and four columns in order to create a Latin square.
## Latin Square Design (Cont.)
- Compared to RCBD or CRD, Latin square design has two nuisance factors: form and school.
- Each treatment occurs only once in each row and once in each column.
- We assume that the three factors (factor of interest and two nuisance factors) are not interacting with each other.
- Row: School; Column: Form
- Treatment factor: Lecture - A/B/C/D
- Nuisance factors: School - 1/2/3/4 and Form - 1/2/3/4
| | Form 1 | Form 2 | Form 3 | Form 4 |
|:--------:|:---------:|:---------:|:---------:|:---------:|
| School 1 | [A]{.red} | D | C | B |
| School 2 | B | [A]{.red} | D | C |
| School 3 | C | B | [A]{.red} | D |
| School 4 | D | C | B | [A]{.red} |
------------------------------------------------------------------------
- Within each cell, we have multiple people.
- A=Lecture Type 1, B=Lecture Type 2, C=Lecture Type 3, D=Lecture Type 4
| | Form 1 | Form 2 | Form 3 | Form 4 |
|:--------:|:---------:|:---------:|:---------:|:---------:|
| School 1 | [A]{.red} | D | C | B |
| School 2 | B | [A]{.red} | D | C |
| School 3 | C | B | [A]{.red} | D |
| School 4 | D | C | B | [A]{.red} |
: {.hover .stripped}
- The number of rows and columns has to correspond to the number of treatment levels. So, if we have four treatments then we would need to have four rows and four columns in order to create a Latin square.
::: callout-tip
- This is just one of many 4×4 squares that you could create. In fact, you can make any size square you want, for any number of treatment
- That each treatment occurs only once in each row and once in each column.
:::
## Benefits of Latin Square Design
- An assumption that we make when using a Latin square design is that the three factors (treatments, and two nuisance factors) do not interact. If this assumption is violated, the Latin Square design error term will be inflated.
- Benefits of Latin Square Design?
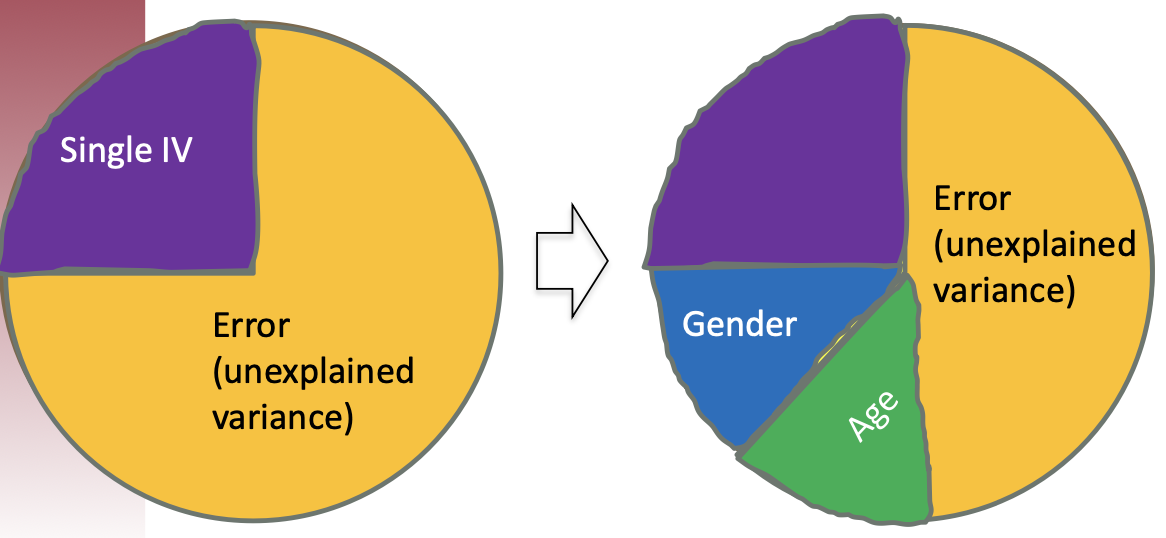
- The more we can control for, the more error variance we explain, **More powerful test of the IV of interest**
::::: columns
::: column
Assuming we use single IV to explain the outcome vs. {IV, Gender, Age} to explain the outcome.
1. Adding gender as a nuisance factor explains more variance, thus reducing the amount of error variance.
2. Adding another nuisance factor is going to explain even more variance
:::
::: column
:::
:::::
## Replicated Latin Square Design
- **Sometimes, the** ***df*** **for a Latin square are too small, so we want to replicate the Latin Square to get more participants.**
- In this example, I replicate it 2 times – the design is different across the replications.
- A=Lecture Type 1, B=Lecture Type 2, C=Lecture Type 3, D=Lecture Type 4
| Rep. #1 | Form 1 | Form 2 | Form 3 | Form 4 | Rep. #2 | Form 1 | Form 2 | Form 3 | Form 4 |
|--------|:------:|:------:|:------:|:------:|--------|:------:|:------:|:------:|:------:|
| **School 1** | A | D | C | B | **School 1** | B | C | D | A |
| **School 2** | B | A | D | C | **School 2** | C | D | A | B |
| **School 3** | C | B | A | D | **School 3** | D | A | B | C |
| **School 4** | D | C | B | A | **School 4** | A | B | C | D |
: Replicated Latin Square Design
## More than two blocking factors? Greco-Roman Squares
- **When might this occur?**
- Maybe we think “day of the week has an impact”
- α=Monday, β=Tuesday, 𝜒=Wednesday, 𝜆=Thursday
- This is a **“Greco-Roman squares”** design.
- Greco-Roman squares are a type of combinatorial design consisting of two orthogonal Latin squares of the same order, where each cell contains an ordered pair of symbols from two distinct sets.
+-------------+------------------------------------+------------------------------------+------------------------------------+------------------------------------+
| | Form 1 | Form 2 | Form 3 | Form 4 |
+=============+:==================================:+:==================================:+:==================================:+:==================================:+
| School 1 | A [$\alpha$]{style="color: red"} | B [$\lambda$]{style="color: blue"} | C [$\beta$]{style="color: purple"} | D [$\chi$]{style="color: orange"} |
+-------------+------------------------------------+------------------------------------+------------------------------------+------------------------------------+
| School 2 | B [$\chi$]{style="color: orange"} | A [$\beta$]{style="color: purple"} | D [$\lambda$]{style="color: blue"} | C [$\alpha$]{style="color: red"} |
+-------------+------------------------------------+------------------------------------+------------------------------------+------------------------------------+
| School 3 | C [$\lambda$]{style="color: blue"} | D [$\alpha$]{style="color: red"} | A [$\chi$]{style="color: orange"} | B [$\beta$]{style="color: purple"} |
+-------------+------------------------------------+------------------------------------+------------------------------------+------------------------------------+
| School 4 | D [$\beta$]{style="color: purple"} | C [$\chi$]{style="color: orange"} | B [$\alpha$]{style="color: red"} | A [$\lambda$]{style="color: blue"} |
+-------------+------------------------------------+------------------------------------+------------------------------------+------------------------------------+
- Important Considerations about the blocking designs: With Blocking Designs, we still randomly assign individuals within each block.
## End-of-Lecture Comprehensive Quiz
::: {.panel-tabset}
## Exercise
**Comprehensive Quiz: Block Design Concepts**
**Research Scenario:** Dr. Johnson is evaluating four different reading intervention programs (Traditional, Phonics-based, Technology-enhanced, and Peer-tutoring) on reading comprehension scores. She is conducting this study across 12 elementary schools in three different districts. Each school has students from grades 3-5, and she knows that both school district and grade level significantly affect reading performance.
**Questions:**
1. **What type of experimental design would be most appropriate for Dr. Johnson's study if she wants to control for both school district and grade level simultaneously?**
a) Completely Randomized Design (CRD)
b) Randomized Complete Block Design (RCBD) with one blocking factor
c) Latin Square Design
d) Greco-Roman Square Design
2. **In Dr. Johnson's study, if she uses a Latin Square Design with grade levels as rows and school districts as columns, what would the Latin letters (A, B, C, D) represent?**
a) School districts
b) Grade levels
c) Reading comprehension scores
d) The four reading intervention programs
3. **The main difference between a Complete Block Design (CBD) and a Randomized Complete Block Design (RCBD) is:**
a) CBD has more blocking factors than RCBD
b) RCBD includes random assignment of treatments within blocks, while CBD does not
c) CBD is used for continuous variables, RCBD for categorical variables
d) There is no difference between CBD and RCBD
4. **Dr. Johnson's statistical model for an RCBD design would be: $Y_{ij} = \mu + \tau_i + \rho_j + \epsilon_{ij}$. In this context, what does $\rho_j$ represent?**
a) The effect of intervention program i
b) The grand mean
c) The effect of blocking factor j
d) Random error
5. **If Dr. Johnson finds that she needs more degrees of freedom for her analysis, what design modification should she consider?**
a) Use fewer intervention programs
b) Use a Replicated Latin Square Design
c) Eliminate one of the blocking factors
d) Switch to a completely randomized design
6. **Which assumption is MOST critical for the validity of Latin Square Design results?**
a) Equal sample sizes in each cell
b) Normal distribution of the outcome variable
c) No interaction between treatments and blocking factors
d) Random sampling from the population
## Answer
**Answers and Explanations:**
1. **c) Latin Square Design**
- Since Dr. Johnson wants to control for two blocking factors simultaneously (school district and grade level), a Latin Square Design is most appropriate. This design allows her to control for two sources of nuisance variation while testing the four intervention programs.
2. **d) The four reading intervention programs**
- In a Latin Square Design, the Latin letters represent the treatment levels - in this case, the four reading intervention programs (Traditional, Phonics-based, Technology-enhanced, and Peer-tutoring). The rows and columns represent the blocking factors.
3. **b) RCBD includes random assignment of treatments within blocks, while CBD does not**
- The key difference is randomization. In RCBD, treatments are randomly assigned within each block to minimize systematic bias. In CBD, treatments may be assigned systematically, which could introduce confounding effects.
4. **c) The effect of blocking factor j**
- In the RCBD model, $\rho_j$ represents the effect of the blocking factor (e.g., school district or grade level). This parameter captures the systematic differences between blocks that we want to control for.
5. **b) Use a Replicated Latin Square Design**
- When degrees of freedom are insufficient in a Latin Square Design, replication is the standard solution. This involves creating multiple Latin squares with different arrangements, increasing both sample size and degrees of freedom.
6. **c) No interaction between treatments and blocking factors**
- The most critical assumption for Latin Square Design is that there are no interactions between the treatment factor and the two blocking factors. If this assumption is violated, the error term becomes inflated, reducing the power and validity of the analysis.
**Key Takeaway:** Block designs are powerful tools for controlling nuisance variation in experimental research. The choice between RCBD, Latin Square, or more complex designs depends on the number of nuisance factors you need to control and the specific requirements of your study context.
:::
## Summary
- **Block designs help control for nuisance factors** that affect the outcome but are not of primary interest
- **RCBD controls for one blocking factor**, while **Latin Square controls for two blocking factors**
- **Key benefits**: Reduced error variance, increased statistical power, better control of confounding variables
- **Key assumption**: No interaction between treatment and blocking factors (especially critical for Latin Square)
- **When in doubt**: Start with RCBD for one nuisance factor, consider Latin Square for two, and use replication when more degrees of freedom are needed